装饰器与上下文管理器(推荐)
除了 自动追踪 集成之外,您还可以使用 MLflow 的手动追踪 API 来检测您的 Python 代码。当您需要检测自定义 Python 代码时,这尤其有用。
装饰器
mlflow.trace() 装饰器允许您为任何函数创建 span。这种方法提供了一种简单而有效的方式,以最小的努力将追踪添加到您的代码中。
- 🔗 MLflow 检测函数之间的父子关系,使其与自动追踪集成兼容。
- 🛡️ 捕获函数执行期间的异常并将它们记录为 span 事件。
- 📊 自动记录函数名、输入、输出和执行时间。
- 🤝 可以与自动追踪功能一起使用,例如
mlflow.openai.autolog。
@mlflow.trace 装饰器目前支持以下类型的函数
| 函数类型 | 支持 |
|---|---|
| 同步 | 是 |
| 异步 | 是 (>= 2.16.0) |
| 生成器 | 是 (>= 2.20.2) |
| 异步生成器 | 是 (>= 2.20.2) |
示例
以下代码是使用装饰器追踪 Python 函数的最小示例。
为了确保完整的可观察性,如果使用多个装饰器,@mlflow.trace 装饰器通常应该是最外层的那个。有关详细的解释和示例,请参阅 将 @mlflow.trace 与其他装饰器一起使用。
import mlflow


@mlflow.trace(span_type="func", attributes={"key": "value"})
def add_1(x):
    return x + 1


@mlflow.trace(span_type="func", attributes={"key1": "value1"})
def minus_1(x):
    return x - 1


@mlflow.trace(name="Trace Test")
def trace_test(x):
    step1 = add_1(x)
    return minus_1(step1)


trace_test(4)
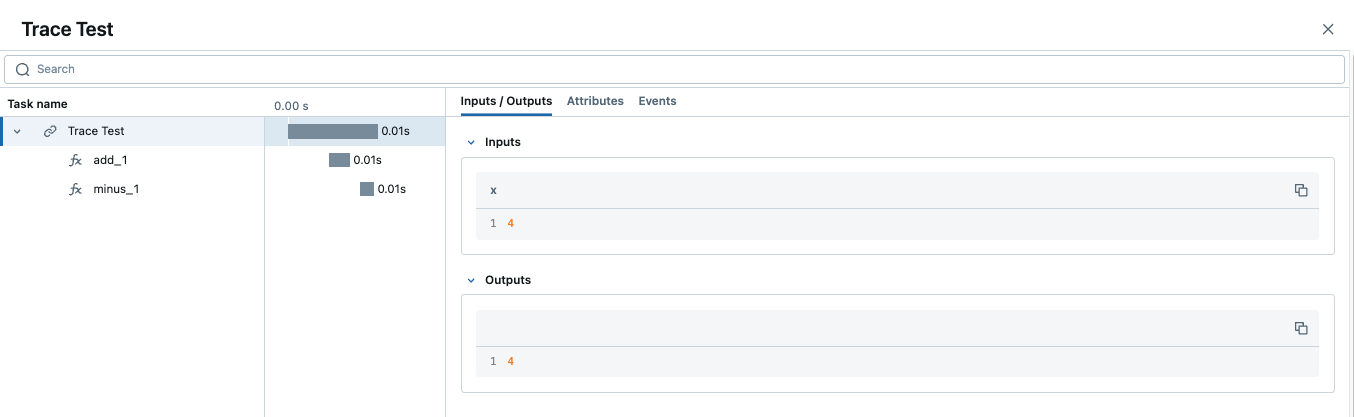
当一个 trace 包含多个同名的 span 时,MLflow 会在它们后面追加一个自动递增的后缀,例如 _1、_2。
自定义 Span
mlflow.trace() 装饰器接受以下参数来自定义要创建的 span
- 🏷️
name参数 覆盖 span 名称,使其与默认值(装饰函数的名称)不同 - 🎯
span_type参数 设置 span 的类型。设置内置 Span 类型 或字符串之一。 - 🏗️
attributes参数 将自定义属性添加到 span。
当将 @mlflow.trace 与其他装饰器(例如,来自 Web 框架的装饰器)组合使用时,至关重要的是使它成为最外层的装饰器。有关正确与不正确排序的清晰示例,请参阅 将 @mlflow.trace 与其他装饰器一起使用。
from mlflow.entities import SpanType


@mlflow.trace(
    name="call-local-llm", span_type=SpanType.LLM, attributes={"model": "gpt-4o-mini"}
)
def invoke(prompt: str):
    return client.invoke(
        messages=[{"role": "user", "content": prompt}], model="gpt-4o-mini"
    )
或者,您可以使用 mlflow.get_current_active_span() API 在函数内部动态更新 span。
from mlflow.entities import SpanType


@mlflow.trace(span_type=SpanType.LLM)
def invoke(prompt: str):
    model_id = "gpt-4o-mini"
    # Get the current span (created by the @mlflow.trace decorator)
    span = mlflow.get_current_active_span()
    # Set the attribute to the span
    span.set_attributes({"model": model_id})
    return client.invoke(messages=[{"role": "user", "content": prompt}], model=model_id)
将 @mlflow.trace 与其他装饰器一起使用
当将多个装饰器应用于单个函数时,至关重要的是将 @mlflow.trace 放置为最外层的装饰器(最顶层的那个)。这确保 MLflow 可以捕获函数的完整执行过程,包括任何内部装饰器的行为。
如果 @mlflow.trace 不是最外层的装饰器,它对函数执行的可视性可能会受到限制或不正确,从而可能导致不完整的 trace 或对函数的输入、输出和执行时间的错误表示。
考虑以下概念性示例
import mlflow
import functools
import time


# A hypothetical additional decorator
def simple_timing_decorator(func):
    @functools.wraps(func)
    def wrapper(*args, **kwargs):
        start_time = time.time()
        result = func(*args, **kwargs)
        end_time = time.time()
        print(
            f"{func.__name__} executed in {end_time - start_time:.4f} seconds by simple_timing_decorator."
        )
        return result

    return wrapper


# Correct order: @mlflow.trace is outermost
@mlflow.trace(name="my_decorated_function_correct_order")
@simple_timing_decorator
# @another_framework_decorator # e.g., @app.route("/mypath") from Flask
def my_complex_function(x, y):
    # Function logic here
    time.sleep(0.1)  # Simulate work
    return x + y


# Incorrect order: @mlflow.trace is NOT outermost
@simple_timing_decorator
@mlflow.trace(name="my_decorated_function_incorrect_order")
# @another_framework_decorator
def my_other_complex_function(x, y):
    time.sleep(0.1)
    return x * y


# Example calls
if __name__ == "__main__":
    print("Calling function with correct decorator order:")
    my_complex_function(5, 3)

    print("\nCalling function with incorrect decorator order:")
    my_other_complex_function(5, 3)
在 my_complex_function 示例(正确的顺序)中,@mlflow.trace 将捕获完整的执行过程,包括 simple_timing_decorator 添加的时间。在 my_other_complex_function(错误的顺序)中,MLflow 捕获的 trace 可能无法准确反映总执行时间,或者可能会遗漏 simple_timing_decorator 在 @mlflow.trace 看到它们之前对输入/输出所做的修改。
添加 Trace 标签
可以将标签添加到 trace 中,以在 trace 级别提供额外的元数据。有几种不同的方法可以在 trace 上设置标签。有关其他方法,请参阅操作指南。
@mlflow.trace
def my_func(x):
    mlflow.update_current_trace(tags={"fruit": "apple"})
    return x + 1
在 UI 中自定义请求和响应预览
MLflow UI 中的“Traces”选项卡显示了 trace 列表,Request 和 Response 列显示了每个 trace 的端到端输入和输出的预览。这使您可以快速了解每个 trace 的代表内容。
默认情况下,这些预览会被截断为固定数量的字符。但是,您可以使用 mlflow.update_current_trace() 函数中的 request_preview 和 response_preview 参数自定义这些列中显示的内容。这对于复杂的输入或输出特别有用,在这些情况下,默认截断可能无法显示最相关的信息。
下面是一个为处理长文档和用户指令的 trace 设置自定义请求预览的示例,旨在在 UI 的 Request 列中呈现最相关的信息
import mlflow


@mlflow.trace(name="Summarization Pipeline")
def summarize_document(document_content: str, user_instructions: str):
    # Construct a custom preview for the request column
    # For example, show beginning of document and user instructions
    request_p = f"Doc: {document_content[:30]}... Instr: {user_instructions[:30]}..."
    mlflow.update_current_trace(request_preview=request_p)

    # Simulate LLM call
    # messages = [
    #     {"role": "system", "content": "Summarize the following document based on user instructions."},
    #     {"role": "user", "content": f"Document: {document_content}\nInstructions: {user_instructions}"}
    # ]
    # completion = client.chat.completions.create(model="gpt-4o-mini", messages=messages)
    # summary = completion.choices[0].message.content
    summary = f"Summary of document starting with '{document_content[:20]}...' based on '{user_instructions}'"

    # Customize the response preview
    response_p = f"Summary: {summary[:50]}..."
    mlflow.update_current_trace(response_preview=response_p)

    return summary


# Example Call
long_document = (
    "This is a very long document that contains many details about various topics..."
    * 10
)
instructions = "Focus on the key takeaways regarding topic X."
summary_result = summarize_document(long_document, instructions)
通过在 trace(通常是根 span)上设置 request_preview 和 response_preview,您可以控制在主 trace 列表视图中如何总结整体交互,从而可以更轻松地一目了然地识别和理解 trace。
自动异常处理
如果在 trace 检测操作的处理过程中引发了 Exception,则 UI 中会显示一个指示,表明调用未成功,并且会提供数据的部分捕获以帮助调试。此外,有关引发的 Exception 的详细信息将包含在部分完成的 span 的 Events 中,从而进一步帮助识别代码中发生问题的位置。
与自动追踪结合
@mlflow.trace 装饰器可以与自动追踪结合使用,以将自动追踪与手动定义的 span 组合到单个有凝聚力且集成的 trace 中。了解更多 此处。
流式传输
自 MLflow 2.20.2 以来,@mlflow.trace 装饰器可用于跟踪返回生成器或迭代器的函数。
@mlflow.trace
def stream_data():
    for i in range(5):
        yield i
上面的示例将为 stream_data 函数生成一个带有单个 span 的 trace。默认情况下,MLflow 将捕获生成器生成的所有元素作为 span 输出中的列表。在上面的示例中,span 的输出将为 [0, 1, 2, 3, 4]。
流函数的 span 将在返回的迭代器开始被消耗时启动,并在迭代器耗尽或迭代期间引发异常时结束。
如果您希望将元素聚合为单个 span 输出,则可以使用 output_reducer 参数来指定用于聚合元素的自定义函数。自定义函数应将生成的元素列表作为输入。
@mlflow.trace(output_reducer=lambda x: ",".join(x))
def stream_data():
    for c in "hello":
        yield c
在上面的示例中,span 的输出将为 "h,e,l,l,o"。原始块仍然可以在 span 的 Events 选项卡中找到。
以下是一个高级示例,该示例使用 output_reducer 将来自 OpenAI LLM 的 ChatCompletionChunk 输出整合到单个消息对象中。
当然,我们建议对类似这样的示例使用 OpenAI 的自动追踪,它执行相同的工作,但只需一行代码。下面的示例仅用于演示目的。
import mlflow
import openai
from openai.types.chat import *
from typing import Optional


def aggregate_chunks(outputs: list[ChatCompletionChunk]) -> Optional[ChatCompletion]:
    """Consolidate ChatCompletionChunks to a single ChatCompletion"""
    if not outputs:
        return None

    first_chunk = outputs[0]
    delta = first_chunk.choices[0].delta
    message = ChatCompletionMessage(
        role=delta.role, content=delta.content, tool_calls=delta.tool_calls or []
    )
    finish_reason = first_chunk.choices[0].finish_reason
    for chunk in outputs[1:]:
        delta = chunk.choices[0].delta
        message.content += delta.content or ""
        message.tool_calls += delta.tool_calls or []
        finish_reason = finish_reason or chunk.choices[0].finish_reason

    base = ChatCompletion(
        id=first_chunk.id,
        choices=[Choice(index=0, message=message, finish_reason=finish_reason)],
        created=first_chunk.created,
        model=first_chunk.model,
        object="chat.completion",
    )
    return base


@mlflow.trace(output_reducer=aggregate_chunks)
def predict(messages: list[dict]):
    stream = openai.OpenAI().chat.completions.create(
        model="gpt-4o-mini",
        messages=messages,
        stream=True,
    )
    for chunk in stream:
        yield chunk


for chunk in predict([{"role": "user", "content": "Hello"}]):
    print(chunk)
在上面的示例中,生成的 predict span 将具有单个聊天完成消息作为输出,该输出由自定义 reducer 函数聚合。
函数包装
函数包装提供了一种灵活的方式来将追踪添加到现有函数,而无需修改其定义。当您想将追踪添加到第三方函数或在您的控制之外定义的函数时,这尤其有用。通过使用 mlflow.trace() 包装外部函数,您可以捕获其输入、输出和执行上下文。
动态包装函数时,“最外层”的概念仍然适用。应在要捕获对包装函数的完整调用的点应用追踪包装器。
import math
import mlflow


def invocation(x, y, exp=2):
    # Wrap an external function from the math library
    traced_pow = mlflow.trace(math.pow)
    raised = traced_pow(x, exp)

    traced_factorial = mlflow.trace(math.factorial)
    factorial = traced_factorial(int(raised))
    return factorial


invocation(4, 2)
上下文管理器
除了装饰器之外,MLflow 还允许创建一个 span,然后可以使用 mlflow.start_span() 上下文管理器在任何封装的任意代码块中访问该 span。这对于以比捕获单个函数的边界更精细的细节捕获代码中的复杂交互非常有用。
与装饰器类似,上下文管理器自动捕获父子关系、异常、执行时间,并且可以与自动追踪一起使用。但是,span 的名称、输入和输出必须手动提供。您可以通过从上下文管理器返回的 mlflow.entities.Span() 对象来设置它们。
import mlflow

with mlflow.start_span(name="my_span") as span:
    span.set_inputs({"x": 1, "y": 2})
    z = x + y
    span.set_outputs(z)
下面是一个稍微复杂的示例,该示例结合使用 mlflow.start_span() 上下文管理器以及装饰器和 OpenAI 的自动追踪。
import mlflow
import openai
from mlflow.entities import SpanType

# Enable auto-tracing for OpenAI
mlflow.openai.autolog()


@mlflow.trace(span_type=SpanType.CHAIN)
def start_session():
    messages = [{"role": "system", "content": "You are a friendly chat bot"}]
    while True:
        with mlflow.start_span(name="User") as span:
            span.set_inputs(messages)
            user_input = input(">> ")
            span.set_outputs(user_input)

        if user_input == "BYE":
            break

        messages.append({"role": "user", "content": user_input})

        response = openai.OpenAI().chat.completions.create(
            model="gpt-4o-mini",
            max_tokens=100,
            messages=messages,
        )
        answer = response.choices[0].message.content
        print(f"🤖: {answer}")

        messages.append({"role": "assistant", "content": answer})


start_session()
高级功能
多线程
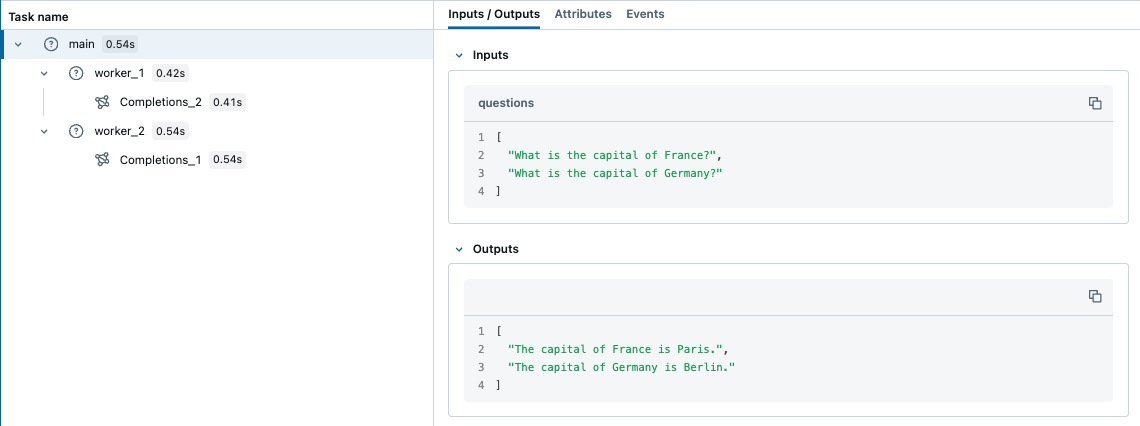
MLflow 追踪是线程安全的,默认情况下,trace 按每个线程隔离。但是,您也可以通过一些额外的步骤创建一个跨越多个线程的 trace。
MLflow 使用 Python 的内置 ContextVar 机制来确保线程安全,默认情况下,该机制不会跨线程传播。因此,您需要手动将上下文从主线程复制到工作线程,如下例所示。
import contextvars
from concurrent.futures import ThreadPoolExecutor, as_completed
import mlflow
from mlflow.entities import SpanType
import openai

client = openai.OpenAI()

# Enable MLflow Tracing for OpenAI
mlflow.openai.autolog()


@mlflow.trace
def worker(question: str) -> str:
    messages = [
        {"role": "system", "content": "You are a helpful assistant."},
        {"role": "user", "content": question},
    ]
    response = client.chat.completions.create(
        model="gpt-4o-mini",
        messages=messages,
        temperature=0.1,
        max_tokens=100,
    )
    return response.choices[0].message.content


@mlflow.trace
def main(questions: list[str]) -> list[str]:
    results = []
    # Almost same as how you would use ThreadPoolExecutor, but two additional steps
    #  1. Copy the context in the main thread using copy_context()
    #  2. Use ctx.run() to run the worker in the copied context
    with ThreadPoolExecutor(max_workers=2) as executor:
        futures = []
        for question in questions:
            ctx = contextvars.copy_context()
            futures.append(executor.submit(ctx.run, worker, question))
        for future in as_completed(futures):
            results.append(future.result())
    return results


questions = [
    "What is the capital of France?",
    "What is the capital of Germany?",
]

main(questions)
相比之下,默认情况下,ContextVar 会复制到异步任务。因此,在使用 asyncio 时,您不需要手动复制上下文,这可能是在 Python 中使用 MLflow 追踪处理并发 I/O 绑定任务的一种更简单的方法。
异步支持
@mlflow.trace 装饰器与异步函数无缝协作
import asyncio
import mlflow


@mlflow.trace
async def async_operation(data: str) -> str:
    # Simulate async work
    await asyncio.sleep(0.1)
    return f"Processed: {data}"


@mlflow.trace
async def async_pipeline(items: list[str]) -> list[str]:
    results = []
    for item in items:
        result = await async_operation(item)
        results.append(result)
    return results


# Run the async pipeline
asyncio.run(async_pipeline(["item1", "item2", "item3"]))
底层客户端 API
对于需要完全控制 trace 生命周期的高级场景,MLflow 提供了底层客户端 API。仅当装饰器和上下文管理器无法满足您的要求时,才建议使用这些 API。
使用客户端 API 来
- 👨💼 手动父子关系控制
- 🛠️ 精确控制 span 的起点和终点
⚠️ 重要限制
- ❌ 不会自动检测父子关系
- 🛠️ 需要手动异常处理
- 🚫 与自动追踪集成不兼容
- 📋 需要显式的 span 生命周期管理
基本示例
from mlflow import MlflowClient

client = MlflowClient()

# Start trace (creates root span)
root_span = client.start_trace(name="my_application_flow", inputs={"user_id": "123"})

try:
    # Create child span
    child_span = client.start_span(
        name="processing_step",
        request_id=root_span.request_id,
        parent_id=root_span.span_id,
        inputs={"data": "sample"},
    )

    # Do work
    result = perform_operation()

    # End child span
    client.end_span(
        request_id=child_span.request_id,
        span_id=child_span.span_id,
        outputs={"result": result},
        status="OK",
    )

except Exception as e:
    # Handle errors manually
    client.end_span(
        request_id=child_span.request_id,
        span_id=child_span.span_id,
        status="ERROR",
        attributes={"error": str(e)},
    )
    raise
finally:
    # End root trace
    client.end_trace(request_id=root_span.request_id, outputs={"status": "completed"})
何时使用不同的方法
- 🎯 装饰器:简单的函数追踪,最常见的用例
- 📦 上下文管理器:复杂的代码块,手动输入/输出控制
- 🔧 客户端 API:自定义 trace ID,分布式追踪,现有系统集成
最佳实践
- 📝 使用描述性 span 名称:选择清楚描述 span 功能的名称,使 trace 更易于理解和调试。
- 🎯 将
@mlflow.trace应用为最外层装饰器:这确保在使用多个装饰器时可以完全了解函数执行情况。 - 🤝 与自动追踪结合:使用手动 span 在自动追踪操作周围添加上下文,以实现全面的可观察性。
- 🏗️ 设置有意义的属性:添加有助于调试和分析的自定义属性,例如模型名称、处理参数或业务上下文。
- 🛡️ 优雅地处理错误:装饰器会自动捕获异常,但您可以根据需要添加自定义错误处理和其他上下文。
- 🎛️ 选择正确的方法:对于简单的情况使用装饰器,对于复杂的块使用上下文管理器,只有在需要完全控制时才使用客户端 API。
- ⚡ 为高吞吐量实施采样:使用条件追踪和采样策略来平衡可观察性和性能。
- 🌐 在分布式系统中传播上下文:确保 trace 上下文在服务边界之间正确流动。
后续步骤
与自动追踪结合:混合使用自动和手动追踪以实现最佳可观察性
Trace 概念:了解 MLflow trace 的结构和组件
查询 Trace:以编程方式搜索和分析您的 trace