Tracing LangGraph🦜🕸️
LangGraph 是一个用于构建具有 LLM 的有状态、多参与者应用程序的开源库,用于创建代理和多代理工作流。
MLflow Tracing 提供 LangGraph 的自动跟踪功能,作为其 LangChain 集成的扩展。通过调用 mlflow.langchain.autolog() 函数启用 LangChain 的自动跟踪,MLflow 将自动将图执行捕获到跟踪中并将其记录到活动的 MLflow 实验中。在 TypeScript 中,您可以将 MLflow LangChain 回调传递给 callbacks 选项。
- Python
- JS / TS
import mlflow

mlflow.langchain.autolog()
LangGraph.js 跟踪通过 OpenTelemetry 摄取支持。有关完整的设置,请参阅下面的 入门部分。
开始使用
MLflow 支持 Python 和 TypeScript/JavaScript 中的 LangGraph 跟踪。请选择下面的相应选项卡以开始。
- Python
- JS / TS
1. 启动 MLflow
如果您还没有 MLflow 服务器,请按照 自托管指南 启动 MLflow 服务器。
2. 安装依赖项
pip install langgraph langchain-openai mlflow
3. 启用跟踪
import mlflow

# Calling autolog for LangChain will enable trace logging.
mlflow.langchain.autolog()

# Optional: Set a tracking URI and an experiment
mlflow.set_experiment("LangChain")
mlflow.set_tracking_uri("https://:5000")
4. 定义 LangGraph 代理并调用它
from typing import Literal

import mlflow

from langchain_core.messages import AIMessage, ToolCall
from langchain_core.outputs import ChatGeneration, ChatResult
from langchain_core.tools import tool
from langchain_openai import ChatOpenAI
from langgraph.prebuilt import create_react_agent

# Enabling tracing for LangGraph (LangChain)
mlflow.langchain.autolog()

# Optional: Set a tracking URI and an experiment
mlflow.set_tracking_uri("https://:5000")
mlflow.set_experiment("LangGraph")


@tool
def get_weather(city: Literal["nyc", "sf"]):
    """Use this to get weather information."""
    if city == "nyc":
        return "It might be cloudy in nyc"
    elif city == "sf":
        return "It's always sunny in sf"


llm = ChatOpenAI(model="gpt-4o-mini")
tools = [get_weather]
graph = create_react_agent(llm, tools)

# Invoke the graph
result = graph.invoke(
    {"messages": [{"role": "user", "content": "what is the weather in sf?"}]}
)
5. 在 MLflow UI 中查看跟踪
访问 https://:5000(或您的自定义 MLflow 跟踪服务器 URL)以在 MLflow UI 中查看跟踪。
1. 启动 MLflow
如果您还没有 MLflow 服务器,请按照 自托管指南 启动 MLflow 服务器。
2. 安装所需的依赖项:
npm i @langchain/langgraph @langchain/core @langchain/openai @arizeai/openinference-instrumentation-langchain
3. 启用 OpenTelemetry
在您的应用程序中为 LangChain 启用 OpenTelemetry 仪器
import { NodeTracerProvider, SimpleSpanProcessor } from "@opentelemetry/sdk-trace-node";
import { OTLPTraceExporter } from "@opentelemetry/exporter-trace-otlp-proto";
import { LangChainInstrumentation } from "@arizeai/openinference-instrumentation-langchain";
import * as CallbackManagerModule from "@langchain/core/callbacks/manager";

// Set up the OpenTelemetry
const provider = new NodeTracerProvider(
  {
    spanProcessors: [new SimpleSpanProcessor(new OTLPTraceExporter({
      // Set MLflow tracking server URL with `/v1/traces` path. You can also use the OTEL_EXPORTER_OTLP_TRACES_ENDPOINT environment variable instead.
      url: "https://:5000/v1/traces",
      // Set the experiment ID in the header. You can also use the OTEL_EXPORTER_OTLP_TRACES_HEADERS environment variable instead.
      headers: {
        "x-mlflow-experiment-id": "123",
      },
    }))],
  }
);
provider.register();

// Enable LangChain instrumentation
const lcInstrumentation = new LangChainInstrumentation();
lcInstrumentation.manuallyInstrument(CallbackManagerModule);
4. 定义 LangGraph 代理并调用它
根据 LangGraph 示例 定义 LangGraph 代理并调用它。
5. 在 MLflow UI 中查看跟踪
访问 https://:5000(或您的自定义 MLflow 跟踪服务器 URL)以在 MLflow UI 中查看跟踪。
令牌使用跟踪
MLflow >= 3.1.0 支持 LangGraph 的 token 使用量跟踪。在图调用期间,每个 LLM 调用的 token 使用量将记录在 mlflow.chat.tokenUsage span 属性中,整个跟踪的总使用量将记录在 mlflow.trace.tokenUsage 元数据字段中。
import json
import mlflow

mlflow.langchain.autolog()

# Execute the agent graph defined in the previous example
graph.invoke({"messages": [{"role": "user", "content": "what is the weather in sf?"}]})

# Get the trace object just created
last_trace_id = mlflow.get_last_active_trace_id()
trace = mlflow.get_trace(trace_id=last_trace_id)

# Print the token usage
total_usage = trace.info.token_usage
print("== Total token usage: ==")
print(f"  Input tokens: {total_usage['input_tokens']}")
print(f"  Output tokens: {total_usage['output_tokens']}")
print(f"  Total tokens: {total_usage['total_tokens']}")

# Print the token usage for each LLM call
print("\n== Token usage for each LLM call: ==")
for span in trace.data.spans:
    if usage := span.get_attribute("mlflow.chat.tokenUsage"):
        print(f"{span.name}:")
        print(f"  Input tokens: {usage['input_tokens']}")
        print(f"  Output tokens: {usage['output_tokens']}")
        print(f"  Total tokens: {usage['total_tokens']}")
== Total token usage: ==
  Input tokens: 149
  Output tokens: 135
  Total tokens: 284

== Token usage for each LLM call: ==
ChatOpenAI_1:
  Input tokens: 58
  Output tokens: 87
  Total tokens: 145
ChatOpenAI_2:
  Input tokens: 91
  Output tokens: 48
  Total tokens: 139
在节点或工具中添加 span
通过将自动跟踪与 手动跟踪 API 相结合,您可以在节点或工具内部添加子 span,以获得有关步骤的更详细的见解。
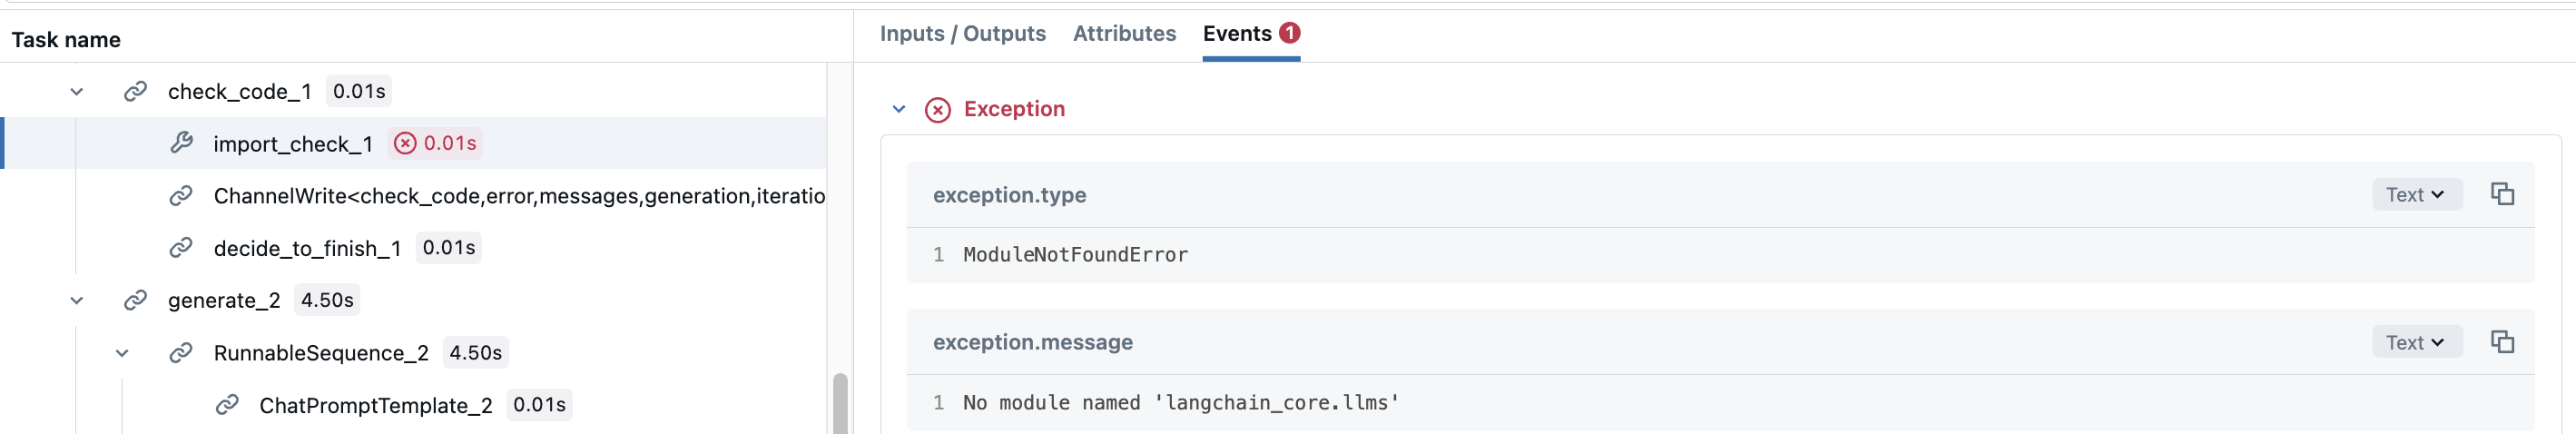
以 LangGraph 的 Code Assistant 教程为例。check_code 节点实际上由两个不同的验证构成,用于验证生成的代码。您可能希望为每个验证添加 span,以查看哪些验证已被执行。要做到这一点,只需在节点函数内部创建手动 span。
def code_check(state: GraphState):
    # State
    messages = state["messages"]
    code_solution = state["generation"]
    iterations = state["iterations"]

    # Get solution components
    imports = code_solution.imports
    code = code_solution.code

    # Check imports
    try:
        # Create a child span manually with mlflow.start_span() API
        with mlflow.start_span(name="import_check", span_type=SpanType.TOOL) as span:
            span.set_inputs(imports)
            exec(imports)
            span.set_outputs("ok")
    except Exception as e:
        error_message = [("user", f"Your solution failed the import test: {e}")]
        messages += error_message
        return {
            "generation": code_solution,
            "messages": messages,
            "iterations": iterations,
            "error": "yes",
        }

    # Check execution
    try:
        code = imports + "\n" + code
        with mlflow.start_span(name="execution_check", span_type=SpanType.TOOL) as span:
            span.set_inputs(code)
            exec(code)
            span.set_outputs("ok")
    except Exception as e:
        error_message = [("user", f"Your solution failed the code execution test: {e}")]
        messages += error_message
        return {
            "generation": code_solution,
            "messages": messages,
            "iterations": iterations,
            "error": "yes",
        }

    # No errors
    return {
        "generation": code_solution,
        "messages": messages,
        "iterations": iterations,
        "error": "no",
    }
这样,check_code 节点的可 span 将具有子 span,这些子 span 记录每个验证是失败还是成功,并带有它们的异常详细信息。
当在 LangGraph 节点或工具中使用异步方法(如 ainvoke())并结合手动 @mlflow.trace 装饰器时,请启用内联跟踪器执行,以确保正确的上下文传播
mlflow.langchain.autolog(run_tracer_inline=True)
这可确保手动跟踪的 span 正确嵌套在自动日志跟踪层次结构中。如果没有此设置,在异步场景中,手动 span 可能会显示为独立的跟踪。
启用 run_tracer_inline=True 时,请避免在同一个异步函数中连续调用多个图,因为这可能会导致跟踪意外合并。如果您需要进行多次顺序调用,则可以
- 将每次调用包装在一个单独的异步任务中
- 如果您不需要手动跟踪集成,请使用默认的
run_tracer_inline=False
线程 ID 跟踪
自 MLflow 3.6 起,MLflow 将自动记录跟踪的线程(会话)ID,并允许您在 UI 中将一组跟踪视为一个会话。要启用此功能,您需要在调用图时在配置中传递 thread_id。
graph.invoke(inputs, {"configurable": {"thread_id": "1"}})
线程 ID 将记录在跟踪元数据中,并在 MLflow Trace UI 中显示。
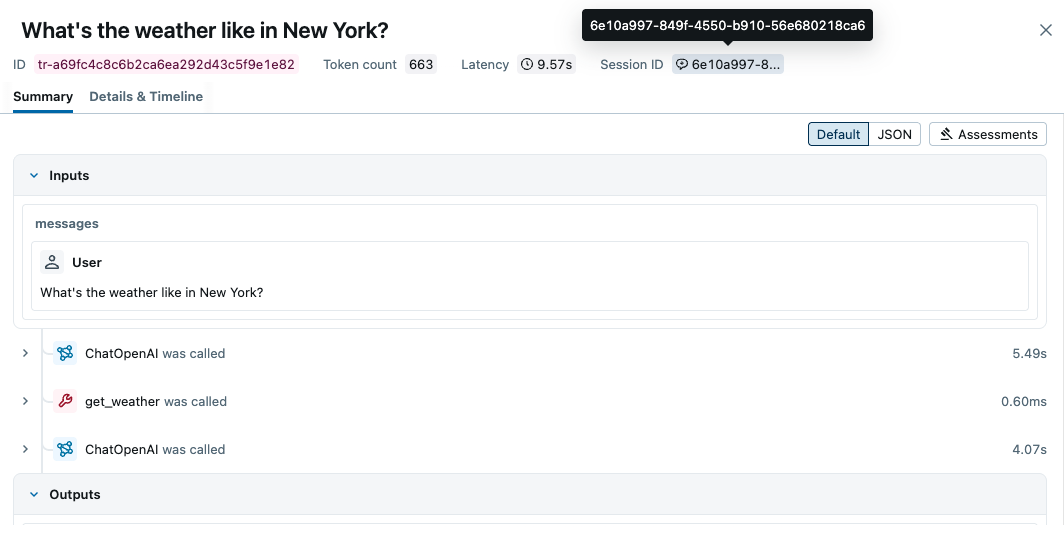
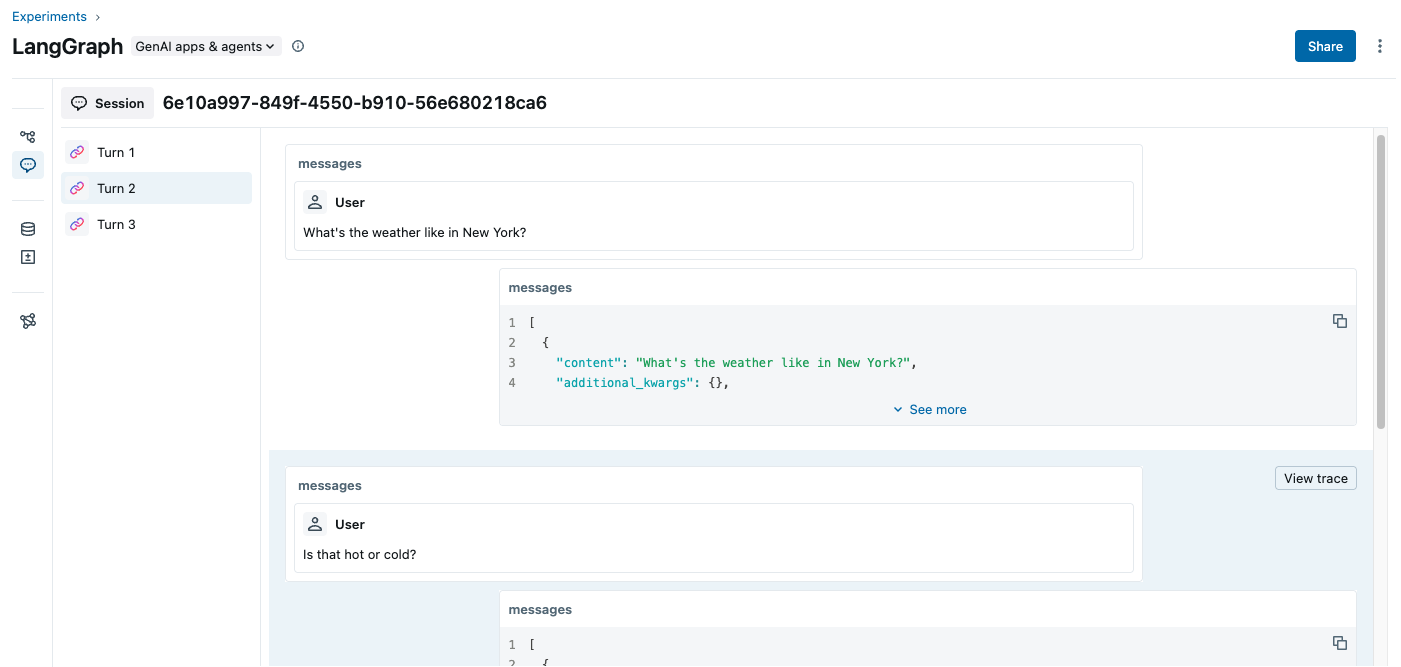
通过导航到侧边栏中的“会话”选项卡,您可以查看会话中的所有跟踪。
禁用自动跟踪
可以通过调用 mlflow.langchain.autolog(disable=True) 或 mlflow.autolog(disable=True) 来全局禁用 LangGraph 的自动跟踪。