Tracing Quickstart
本快速入门指南将引导您完成使用 MLflow Tracing 设置简单的 GenAI 应用程序。您将在不到 10 分钟的时间内启用跟踪、运行基本应用程序,并在 MLflow UI 中探索生成的跟踪。
先决条件
请确保您已启动 MLflow 服务器。如果您尚未运行 MLflow 服务器,请按照以下简单步骤进行启动。
- 本地 (pip)
- 本地 (docker)
Python 环境: Python 3.10+
为了最快的设置,您可以通过 pip 安装 mlflow Python 包并本地启动 MLflow 服务器。
pip install --upgrade mlflow
mlflow server
MLflow 提供了一个 Docker Compose 文件,用于启动一个本地 MLflow 服务器,其中包含一个 postgres 数据库和一个 minio 服务器。
git clone --depth 1 --filter=blob:none --sparse https://github.com/mlflow/mlflow.git
cd mlflow
git sparse-checkout set docker-compose
cd docker-compose
cp .env.dev.example .env
docker compose up -d
有关更多详细信息,请参阅 说明,例如覆盖默认环境变量。
创建 MLflow 实验
您的 GenAI 应用程序将发送到 MLflow 服务器的追踪会被分组到 MLflow 实验中。我们建议为每个 GenAI 应用程序创建一个实验。
让我们使用 MLflow UI 创建一个新的 MLflow 实验,以便您可以开始发送您的追踪。
- 在浏览器中导航到 MLflow UI,地址为 https://:5000。
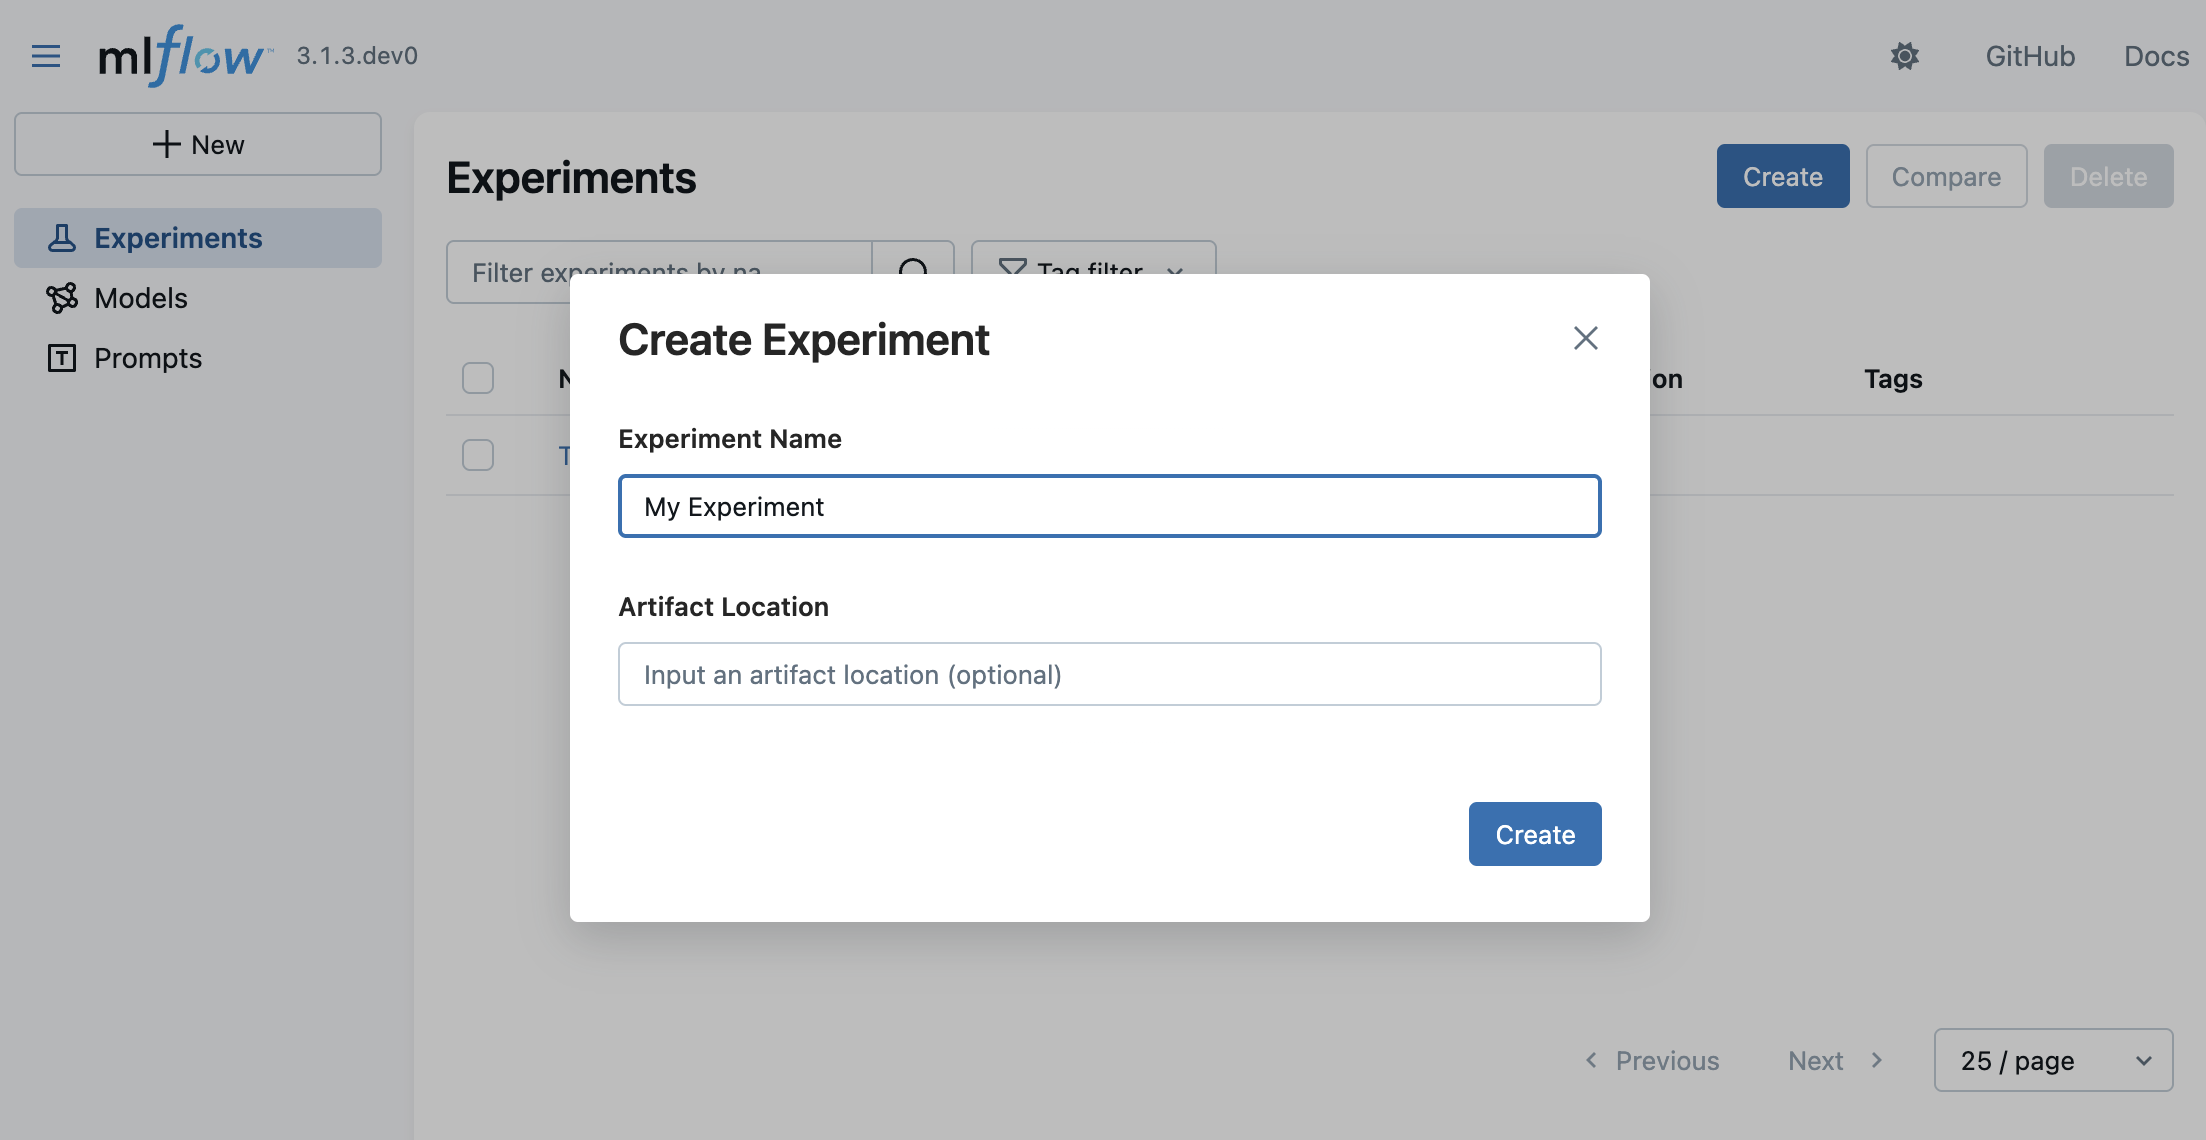
- 点击右上角的Create按钮。
- 输入实验名称,然后点击“Create”。
您可以暂时将 Artifact Location 字段留空。这是一个高级配置,用于覆盖 MLflow 存储实验数据的位置。
依赖项
要将您的 GenAI 应用程序连接到 MLflow 服务器,您需要安装 MLflow 客户端 SDK。
- Python (OpenAI)
- TypeScript (OpenAI)
pip install --upgrade mlflow openai>=1.0.0
npm install mlflow-openai
虽然本指南以使用 OpenAI SDK 的示例为特色,但相同的步骤也适用于其他 LLM 提供商,包括 Anthropic、Google、Bedrock 等。
有关 MLflow 支持的 LLM 提供商的完整列表,请参阅 LLM 集成概述。
开始追踪
创建实验后,您就可以连接到 MLflow 服务器并开始从您的 GenAI 应用程序发送追踪了。
- Python (OpenAI)
- TypeScript (OpenAI)
- OpenTelemetry
import mlflow
from openai import OpenAI

# Specify the tracking URI for the MLflow server.
mlflow.set_tracking_uri("https://:5000")

# Specify the experiment you just created for your GenAI application.
mlflow.set_experiment("My Application")

# Enable automatic tracing for all OpenAI API calls.
mlflow.openai.autolog()

client = OpenAI()
# The trace of the following is sent to the MLflow server.
client.chat.completions.create(
    model="o4-mini",
    messages=[
        {"role": "system", "content": "You are a helpful weather assistant."},
        {"role": "user", "content": "What's the weather like in Seattle?"},
    ],
)
import { init } from "mlflow-tracing";
import { tracedOpenAI } from "mlflow-openai";
import { OpenAI } from "openai";

init({
    trackingUri: "https://:5000",
    // NOTE: specifying experiment name is not yet supported in TypeScript SDK.
    // You can copy the experiment id from the experiment details on the MLflow UI.
    experimentId: "<experiment-id>",
});

// Wrap the OpenAI client with the tracedOpenAI function to enable automatic tracing.
const client = tracedOpenAI(new OpenAI());

// The trace of the following is sent to the MLflow server.
client.chat.completions.create({
    model: "o4-mini",
    messages: [
        {"role": "system", "content": "You are a helpful weather assistant."},
        {"role": "user", "content": "What's the weather like in Seattle?"},
    ],
})
MLflow 服务器在 /v1/traces 处公开一个 OTLP 端点(OTLP)。此端点接受来自任何原生 OpenTelemetry 仪表的追踪,使您能够追踪用 Java、Go、Rust 等其他语言编写的应用程序。
以下示例展示了如何使用 OpenTelemetry FastAPI 仪表来收集来自 FastAPI 应用程序的追踪。
import os
import uvicorn
from fastapi import FastAPI
from opentelemetry.instrumentation.fastapi import FastAPIInstrumentor

# Set the endpoint and header
MLFLOW_TRACKING_URI = "https://:5000"
MLFLOW_EXPERIMENT_ID = "123"

os.environ["OTEL_EXPORTER_OTLP_TRACES_ENDPOINT"] = f"{MLFLOW_TRACKING_URI}/v1/traces"
os.environ[
    "OTEL_EXPORTER_OTLP_TRACES_HEADERS"
] = f"x-mlflow-experiment-id={MLFLOW_EXPERIMENT_ID}"

app = FastAPI()
FastAPIInstrumentor.instrument_app(app)


@app.get("/")
async def root():
    return {"message": "Hello, World!"}


if __name__ == "__main__":
    uvicorn.run(app, host="0.0.0.0", port=8000)
要深入了解如何将 MLflow 与 OpenTelemetry 结合使用,请参阅 OpenTelemetry 指南。
在 MLflow UI 上查看您的追踪
运行上述代码后,转到 MLflow UI,选择“My Application”实验,然后选择“Traces”选项卡。它应该显示新创建的追踪。


下一步
恭喜您使用 MLflow 发送了您的第一个追踪!既然您已经掌握了基础知识,以下是加深对追踪理解的推荐下一步。