搜索 Traces
本指南将引导您了解如何使用 MLflow UI 和 Python API 搜索 MLflow 中的 traces。如果您有兴趣根据 traces 的元数据、标签、执行时间、状态或其他 trace 属性进行查询,本资源将非常有用。
MLflow 的 trace 搜索功能允许您利用类似 SQL 的语法根据各种条件过滤 traces。虽然不支持 OR 关键字,但搜索功能足够强大,可以处理复杂的 trace 发现和分析查询。
本地文件存储仅提供有限的搜索功能,并且随着数据量的增长会变慢。 从 MLflow 3.6.0 开始,FileStore 已弃用。我们建议迁移到基于 SQL 的存储或 Databricks,以获得更好的性能和更强大的搜索功能。
搜索 Traces 概述
在生产环境中处理 MLflow tracing 时,您通常会有成千上万个 traces,分布在不同的实验中,代表各种模型推理、LLM 调用或 ML 管道执行。search_traces API 帮助您根据 traces 的执行特征、元数据、标签和其他属性查找特定的 traces,从而使 trace 分析和调试更加高效。
在 UI 中过滤 Traces
UI 搜索支持与 API 相同的筛选语法,允许您按以下条件搜索:
- Trace inputs
- Trace attributes: trace name, status, end time, execution time, run_id
- Trace tags and metadata
- Trace assessments: feedback or expectations
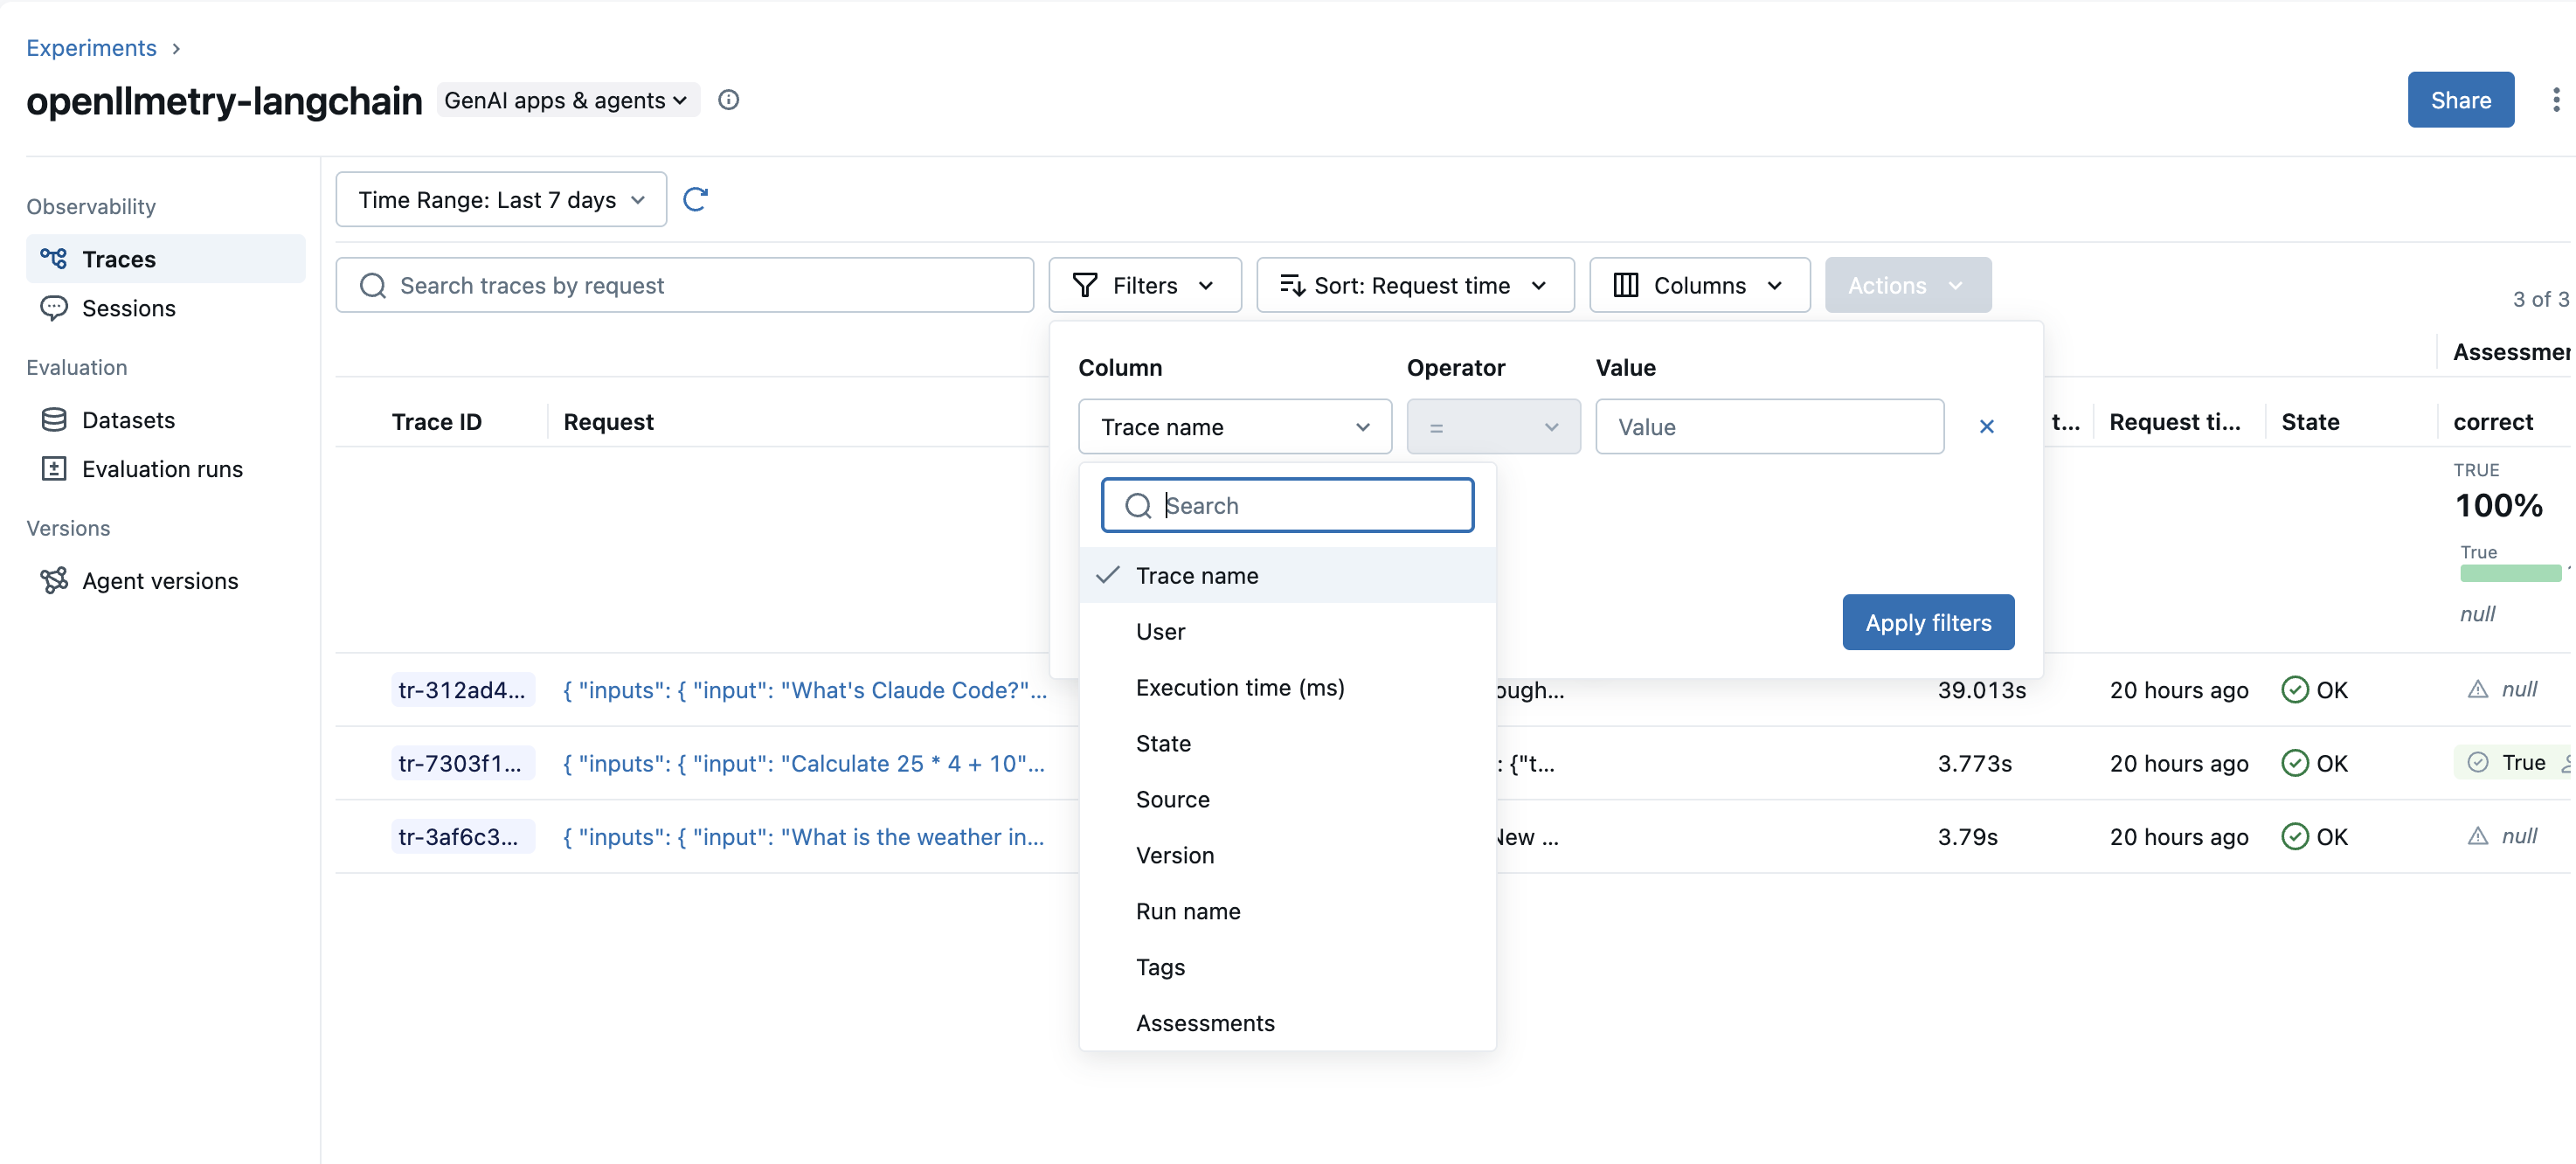
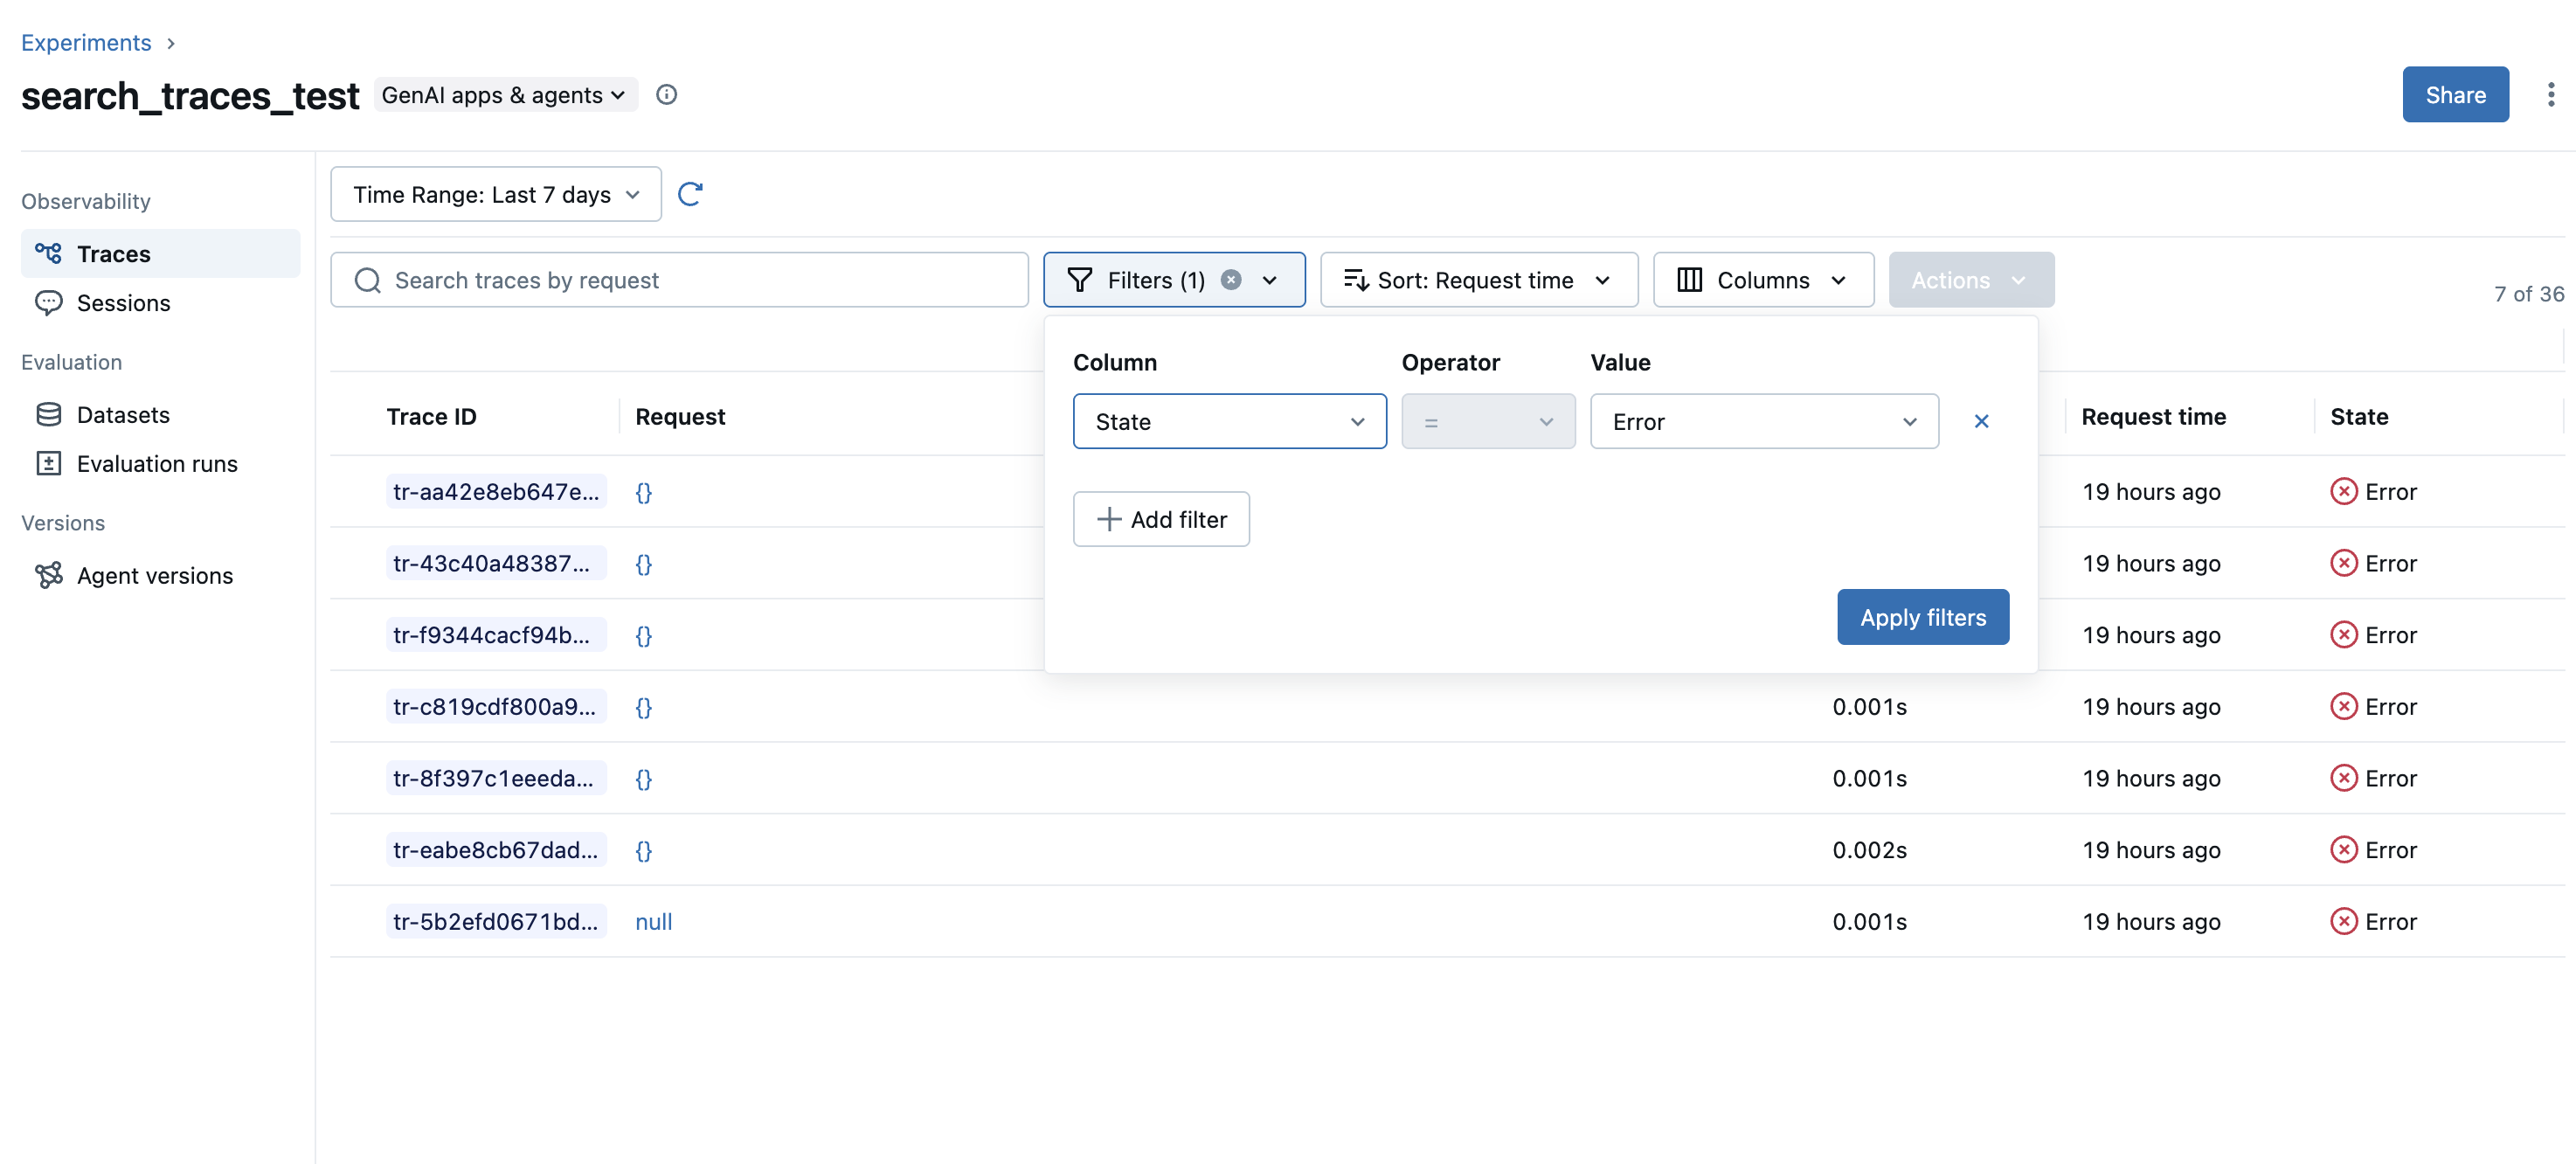
使用 MLflow Trace UI 中的筛选器下拉菜单按各种标准过滤 traces
例如,搜索状态为 ERROR 的 traces
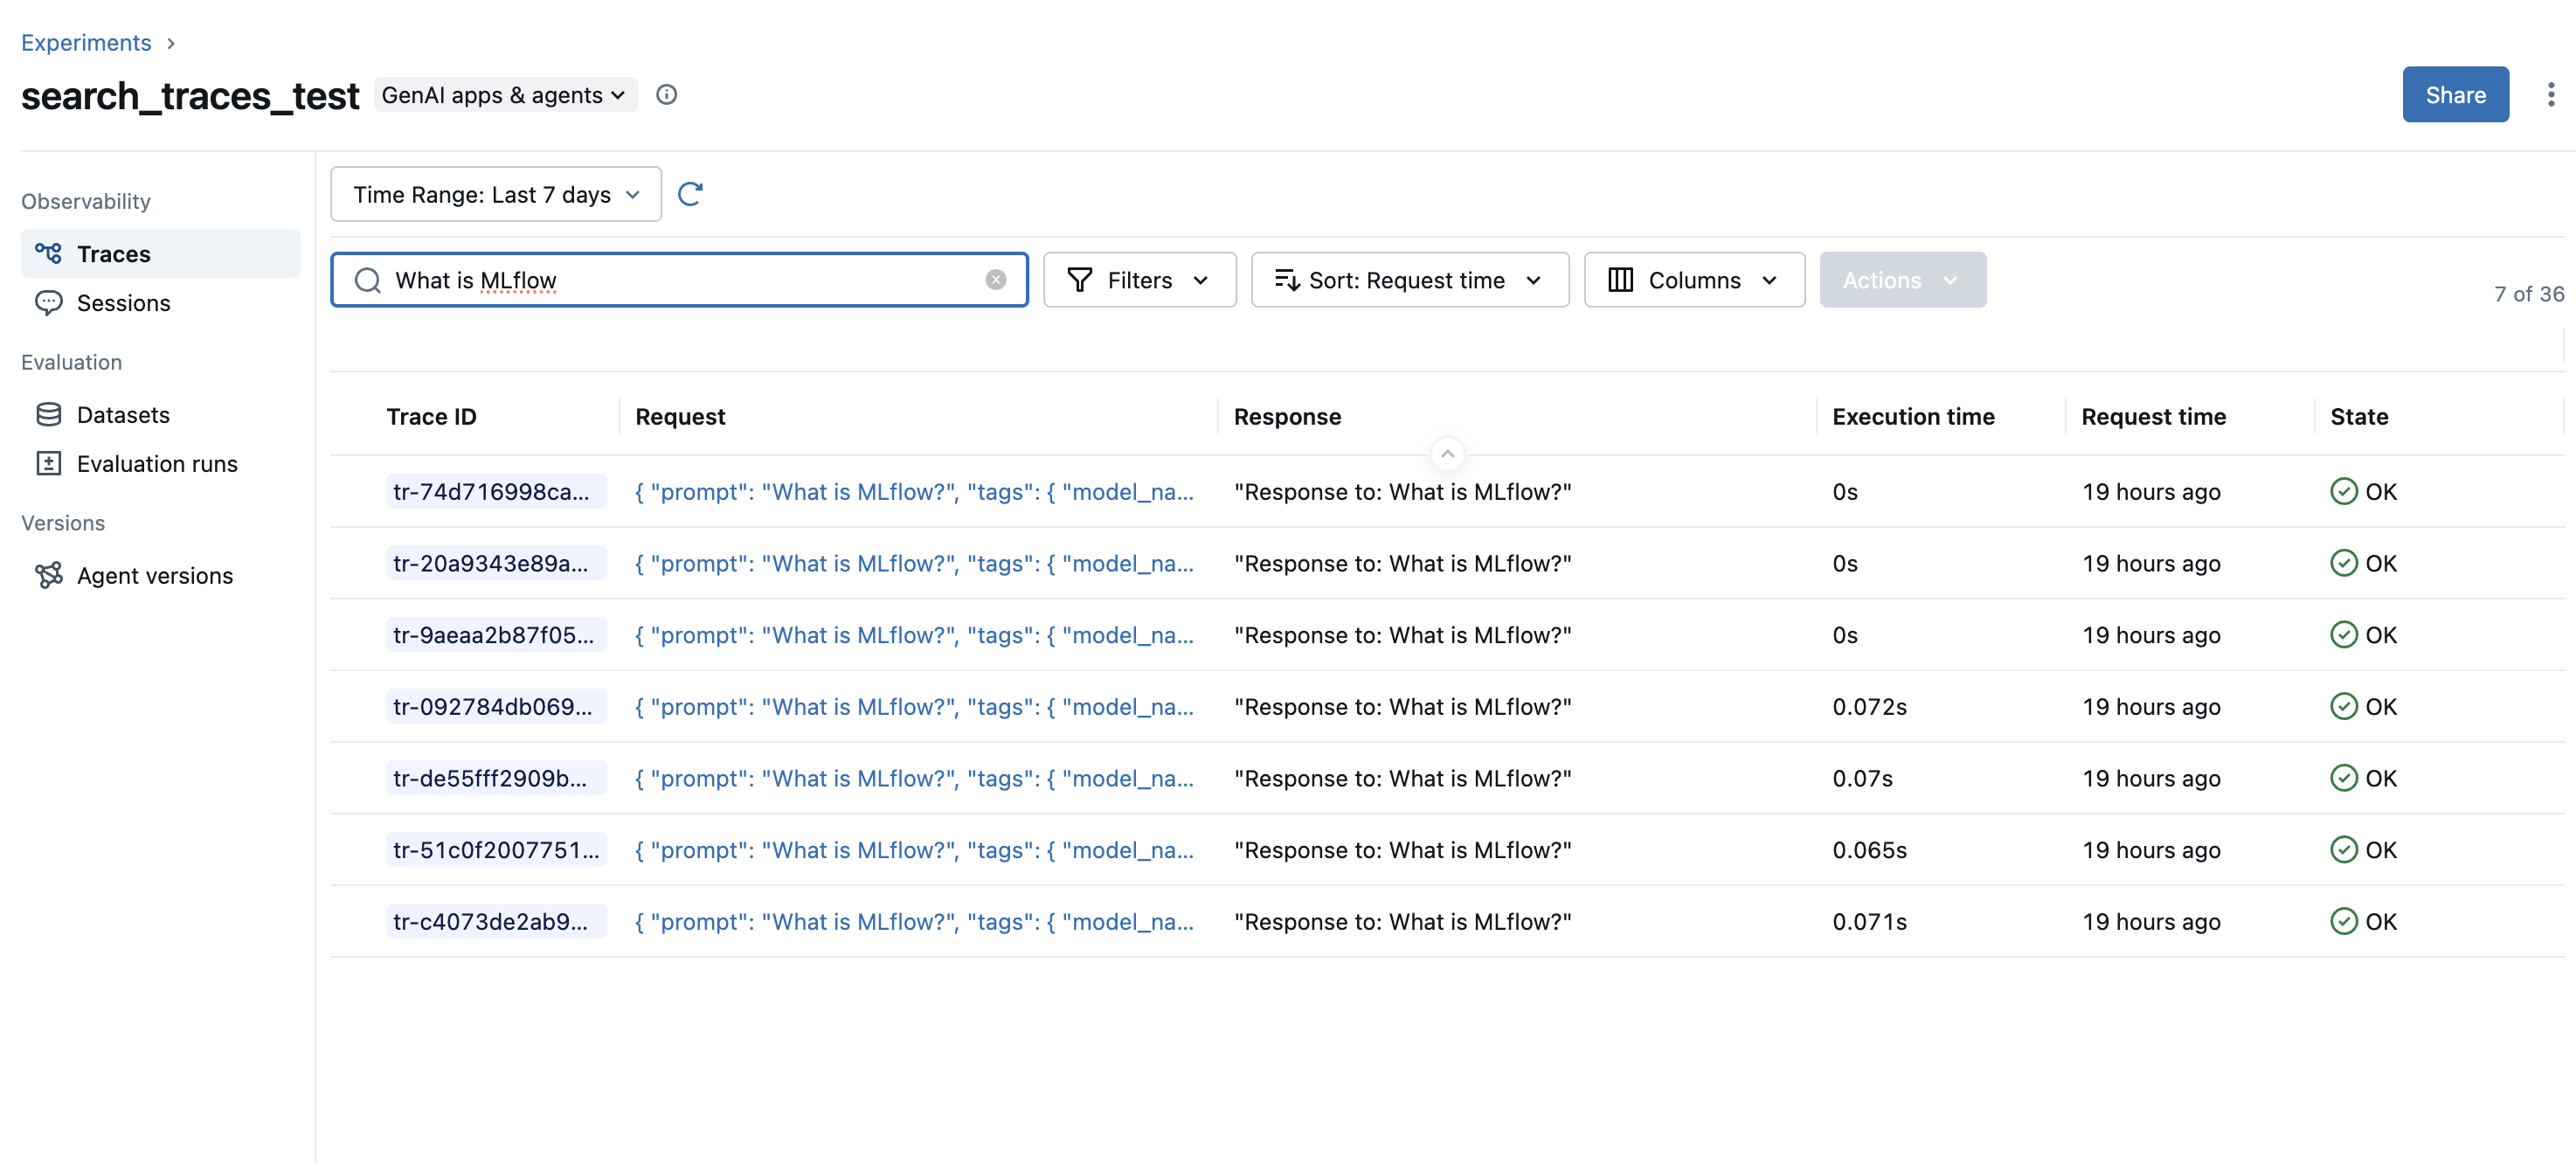
搜索 trace inputs
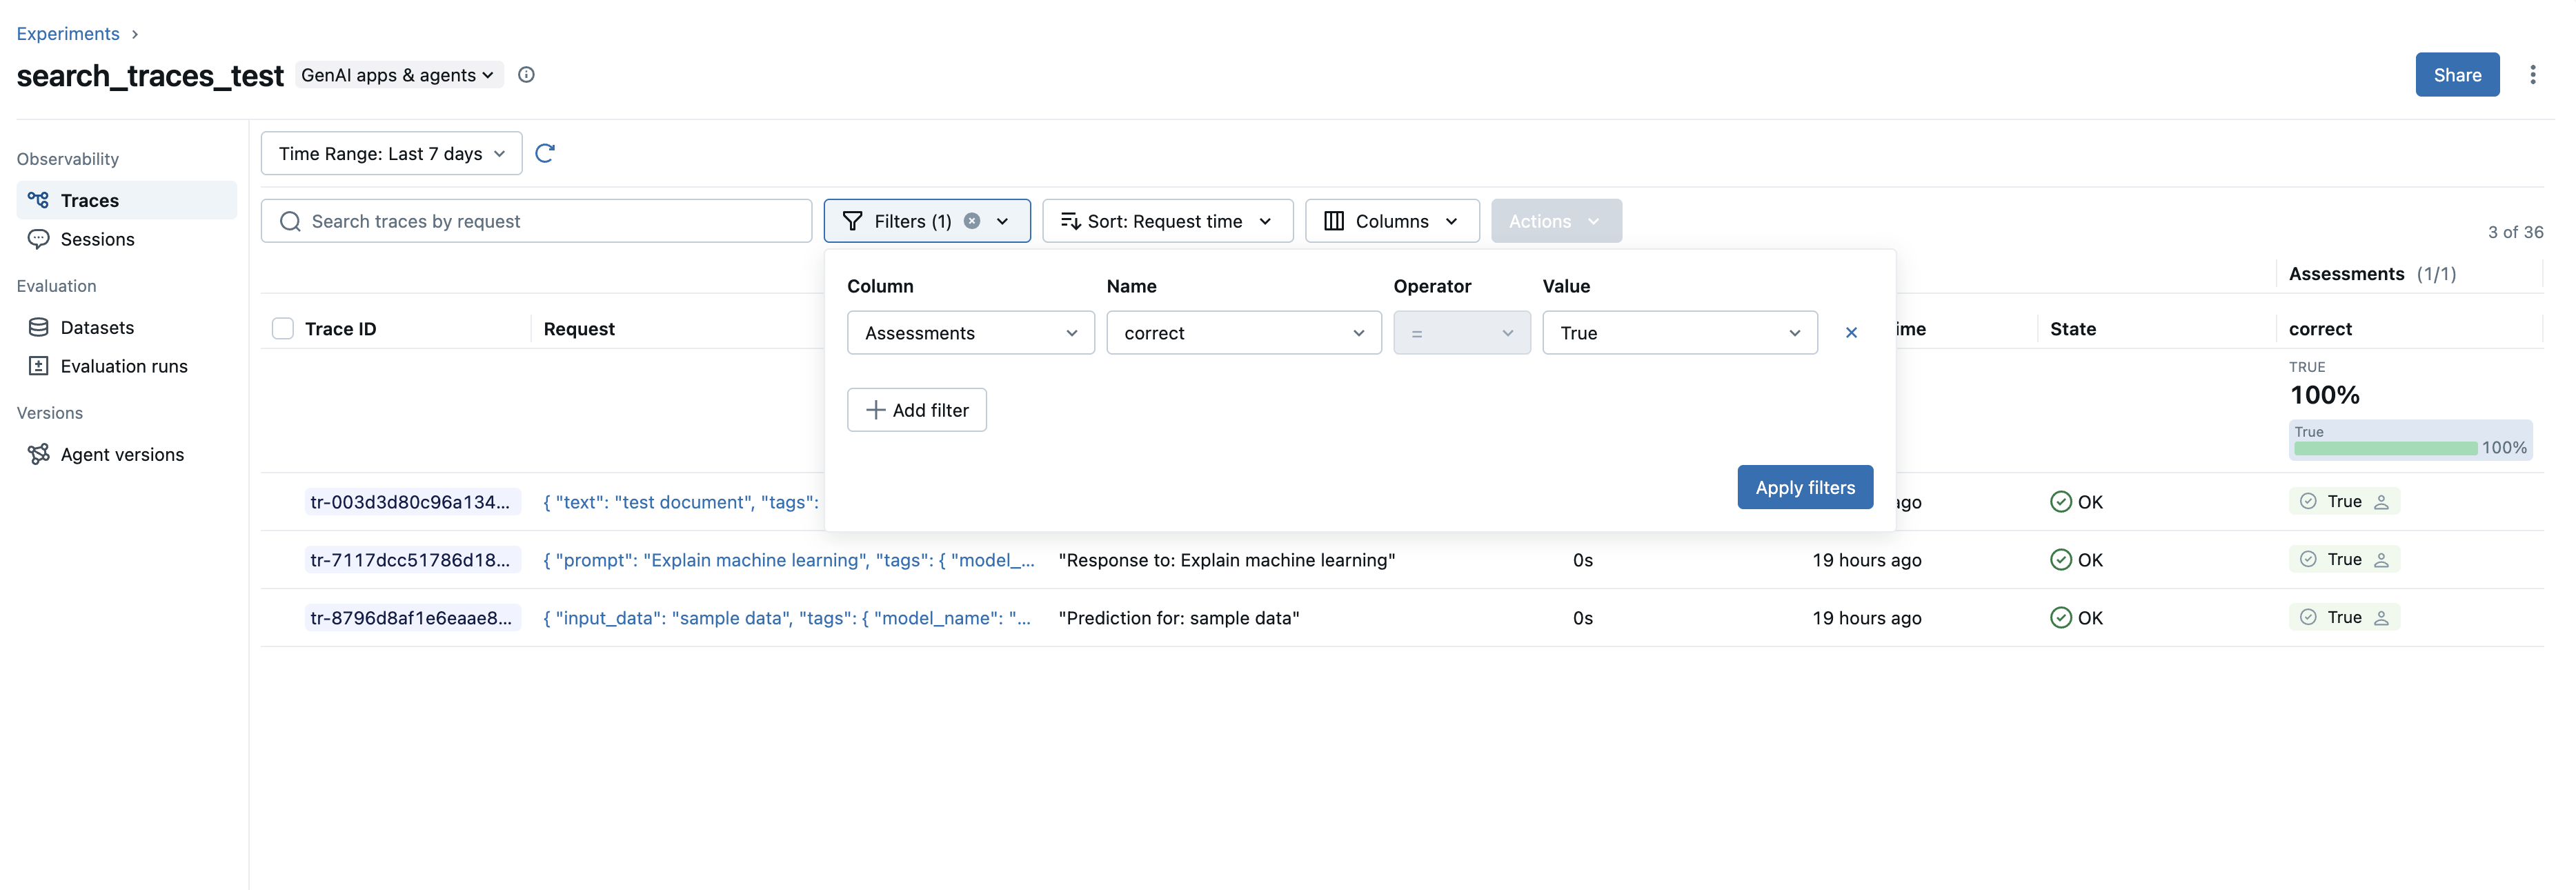
按键和值搜索 trace assessments
搜索查询语法
search_traces API 使用类似 SQL 的领域特定语言 (DSL) 来查询 traces。
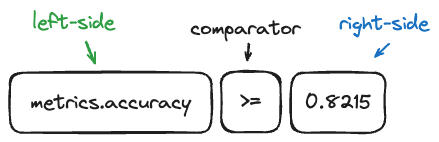
搜索组件的可视化表示:
支持的筛选器和比较器
| 字段类型 | 字段 | 运算符 | 示例 |
|---|---|---|---|
| Trace Status | trace.status | =, != | trace.status = "OK" |
| Trace Timestamps | trace.timestamp_ms, trace.execution_time_ms, trace.end_time_ms | =, !=, >, <, >=, <= | trace.end_time_ms > 1762408895531 |
| Trace IDs | trace.run_id | = | trace.run_id = "run_id" |
| String Fields | trace.client_request_id, trace.name | =, !=, LIKE, ILIKE, RLIKE | trace.name LIKE "%Generate%" |
| Linked Prompts | prompt | = (format: "name/version") | prompt = "qa-system-prompt/4" |
| Span Name/Type | span.name, span.type | =, !=, LIKE, ILIKE, RLIKE | span.type RLIKE "^LLM" |
| Span Attributes | span.attributes.<key> | LIKE, ILIKE | span.attributes.model RLIKE "^gpt" |
| 标签 | tag.<key> | =, !=, LIKE, ILIKE, RLIKE | tag.key = "value" |
| Metadata | metadata.<key> | =, !=, LIKE, ILIKE, RLIKE | metadata.user_id LIKE "user%" |
| 反馈 | feedback.<name> | =, !=, LIKE, ILIKE, RLIKE | feedback.rating = "excellent" |
| 预期 | expectation.<name> | =, !=, LIKE, ILIKE, RLIKE | expectation.result = "pass" |
| Full Text | trace.text | LIKE (with % wildcards) | trace.text LIKE "%tell me a story" |
Value Syntax
- String values must be quoted:
status = 'OK' - Numeric values don't need quotes:
execution_time_ms > 1000 - Tag and metadata values must be quoted as strings
- Full text search must use
LIKEwith%wildcards
Pattern Matching Operators
LIKE: Case-sensitive pattern matching (use%for wildcards)ILIKE: Case-insensitive pattern matching (use%for wildcards)RLIKE: Regular expression matching
示例查询
Full Text Search
搜索 trace 中的任何内容。
# Search for traces containing specific text
mlflow.search_traces(filter_string="trace.text LIKE '%authentication error%'")

# Search for multiple terms
mlflow.search_traces(filter_string="trace.text LIKE '%timeout%'")
按名称过滤
# Exact match
mlflow.search_traces(filter_string="trace.name = 'predict'")

# Pattern matching with LIKE
mlflow.search_traces(filter_string="trace.name LIKE '%inference%'")

# Case-insensitive pattern matching with ILIKE
mlflow.search_traces(filter_string="trace.name ILIKE '%PREDICT%'")

# Regular expression matching with RLIKE
mlflow.search_traces(filter_string="trace.name RLIKE '^(predict|inference)_[0-9]+'")
按状态过滤
# Get successful traces
mlflow.search_traces(filter_string="trace.status = 'OK'")

# Get failed traces
mlflow.search_traces(filter_string="trace.status = 'ERROR'")

# Get in-progress traces
mlflow.search_traces(filter_string="trace.status != 'OK'")
按执行时间过滤
# Find slow traces (> 1 second)
mlflow.search_traces(filter_string="trace.execution_time_ms > 1000")

# Performance range
mlflow.search_traces(
    filter_string="trace.execution_time_ms >= 200 AND trace.execution_time_ms <= 800"
)

# Equal to specific duration
mlflow.search_traces(filter_string="trace.execution_time_ms = 500")
按时间戳过滤
import time

# Get traces from last hour
timestamp = int(time.time() * 1000)
mlflow.search_traces(filter_string=f"trace.timestamp_ms > {timestamp - 3600000}")

# Exact timestamp match
mlflow.search_traces(filter_string=f"trace.timestamp_ms = {timestamp}")

# Timestamp range
mlflow.search_traces(
    filter_string=f"trace.timestamp_ms >= {timestamp - 7200000} AND trace.timestamp_ms <= {timestamp - 3600000}"
)
按标签过滤
# Exact match
mlflow.search_traces(filter_string="tag.model_name = 'gpt-4'")

# Pattern matching with LIKE (case-sensitive)
mlflow.search_traces(filter_string="tag.model_name LIKE 'gpt-%'")

# Case-insensitive pattern matching with ILIKE
mlflow.search_traces(filter_string="tag.environment ILIKE '%prod%'")

# Regular expression matching with RLIKE
mlflow.search_traces(filter_string="tag.version RLIKE '^v[0-9]+\\.[0-9]+'")
按 Run 关联过滤
# Find traces associated with a specific run
mlflow.search_traces(filter_string="trace.run_id = 'run_id_123456'")
按链接的 Prompts 过滤
# Find traces using a specific prompt version
mlflow.search_traces(filter_string='prompt = "qa-agent-system-prompt/4"')
prompt 筛选器仅支持精确匹配 (=) 运算符,格式为 "name/version"。
按 Span 属性过滤
# Filter by span name
mlflow.search_traces(filter_string="span.name = 'llm_call'")

# Pattern matching on span name
mlflow.search_traces(filter_string="span.name LIKE '%embedding%'")

# Filter by span type
mlflow.search_traces(filter_string="span.type = 'LLM'")

# Filter by custom span attributes (requires wildcards with LIKE/ILIKE)
mlflow.search_traces(filter_string="span.attributes.model_version LIKE '%v2%'")
mlflow.search_traces(filter_string="span.attributes.temperature LIKE '%0.7%'")
mlflow.search_traces(filter_string="span.attributes.model_version ILIKE '%V2%'")
按反馈过滤
# Filter by feedback ratings
mlflow.search_traces(filter_string="feedback.rating = 'positive'")

# Pattern matching on feedback
mlflow.search_traces(filter_string="feedback.user_comment LIKE '%helpful%'")
按期望过滤
# Filter by expectation values
mlflow.search_traces(filter_string="expectation.accuracy = 'high'")

# Pattern matching on expectations
mlflow.search_traces(filter_string="expectation.label ILIKE '%success%'")
按结束时间过滤
import time

# Get traces that completed in the last hour
end_time = int(time.time() * 1000)
mlflow.search_traces(filter_string=f"trace.end_time_ms > {end_time - 3600000}")

# Find traces that ended within a specific time range
mlflow.search_traces(
    filter_string=f"trace.end_time_ms >= {end_time - 7200000} AND trace.end_time_ms <= {end_time - 3600000}"
)
组合多个条件
# Complex query with tags and status
mlflow.search_traces(filter_string="trace.status = 'OK' AND tag.importance = 'high'")

# Production error analysis with execution time
mlflow.search_traces(
    filter_string="""
        tag.environment = 'production'
        AND trace.status = 'ERROR'
        AND trace.execution_time_ms > 500
    """
)

# Advanced query with span attributes and feedback
mlflow.search_traces(
    filter_string="""
        span.name LIKE '%llm%'
        AND feedback.rating = 'positive'
        AND trace.execution_time_ms < 1000
    """
)

# Search with pattern matching and time range
mlflow.search_traces(
    filter_string="""
        trace.name ILIKE '%inference%'
        AND trace.timestamp_ms > 1700000000000
        AND span.attributes.model_version LIKE '%v2%'
    """
)
使用 Python 进行程序化搜索
mlflow.search_traces() 提供便捷的 trace 搜索功能
import mlflow

# Basic search with default DataFrame output
traces_df = mlflow.search_traces(filter_string="trace.status = 'OK'")

# Return as list of Trace objects
traces_list = mlflow.search_traces(
    filter_string="trace.status = 'OK'", return_type="list"
)
return_type 参数在 MLflow 2.21.1+ 中可用。对于旧版本,请使用 mlflow.client.MlflowClient.search_traces() 获取列表输出。
返回格式
1. DataFrame
search_traces API 默认返回一个 pandas DataFrame,包含以下列:
- MLflow 3.x
- MLflow 2.x
trace_id- Primary identifiertrace- Trace objectclient_request_id- Client request IDstate- Trace state (OK, ERROR, IN_PROGRESS, STATE_UNSPECIFIED)request_time- Start time in millisecondsexecution_duration- Duration in millisecondsinputs- Input to traced logicoutputs- Output of traced logicexpectations- A dictionary of ground truth labels annotated on the tracetrace_metadata- Key-value metadatatags- Associated tagsassessments- List of assessment objects attached on the trace
request_id- Primary identifiertrace- Trace objecttimestamp_ms- Start time in millisecondsstatus- Trace statusexecution_time_ms- Duration in millisecondsrequest- Input to traced logicresponse- Output of traced logicrequest_metadata- Key-value metadataspans- Spans in tracetags- Associated tags
2. List of Trace Objects
Alternatively, you can specify return_type="list" to get a list of mlflow.entities.Trace() objects instead of a DataFrame.
traces = mlflow.search_traces(filter_string="trace.status = 'OK'", return_type="list")
# list[mlflow.entities.Trace]
Ordering Results
MLflow supports ordering results by the following keys
timestamp_ms(default: DESC) - Trace start timeexecution_time_ms- Trace durationstatus- Trace execution statusrequest_id- Trace identifier
# Order by timestamp (most recent first)
traces = mlflow.search_traces(order_by=["timestamp_ms DESC"])

# Multiple ordering criteria
traces = mlflow.search_traces(order_by=["timestamp_ms DESC", "status ASC"])
Pagination
mlflow.client.MlflowClient.search_traces() supports pagination
from mlflow import MlflowClient

client = MlflowClient()
page_token = None
all_traces = []

while True:
    results = client.search_traces(
        experiment_ids=["1"],
        filter_string="status = 'OK'",
        max_results=100,
        page_token=page_token,
    )

    all_traces.extend(results)

    if not results.token:
        break
    page_token = results.token

print(f"Found {len(all_traces)} total traces")
重要说明
MLflow Version Compatibility
DataFrame Schema: 格式取决于用于 **调用** search_traces API 的 MLflow 版本,而不是用于记录 traces 的版本。MLflow 3.x 的列名与 2.x 不同。
性能提示
- 使用时间戳筛选器 来限制搜索空间
- 限制 max_results 以在排序时获得更快的查询
- 对大型结果集使用分页
Backend Considerations
- SQL Store Backend: 支持上面记录的完整搜索语法,包括
- 所有 trace、span、metadata、tag、feedback 和 expectation 筛选器
- Pattern matching operators (LIKE, ILIKE, RLIKE)
- Full text search with
trace.text - 通过对时间戳进行适当的索引来优化性能
- Local File Store: 搜索功能有限。对于大型数据集可能会变慢。不推荐使用,仅适用于存储少量 traces。