MLflow Tracking 快速入门
欢迎来到 MLflow!
本快速入门旨在提供 MLflow Tracking 最核心和基础 API 的快速指南。具体来说,是那些能够实现模型日志记录、注册和加载以进行推理的 API。
如果你的学习风格更偏向深入和基于教程的方式,请参阅MLflow 入门教程。不过,我们建议你先从这里开始,因为本快速入门使用了 MLflow Tracking 最常见和最常用的 API,为文档中的其他教程奠定了良好的基础。
你将学到什么
只需跟随本快速入门几分钟,你将学到
- 如何记录参数、指标和模型
- MLflow 流式 API 的基础知识
- 如何在记录过程中注册模型
- 如何在 MLflow UI 中导航到模型
- 如何加载已记录的模型进行推理
步骤 1 - 获取 MLflow
MLflow 可在 PyPI 上获取。
安装稳定版本
如果你的系统尚未安装,可以使用以下命令安装
pip install mlflow
安装候选版本 (RC)
如果你渴望测试新功能并验证即将发布的 MLflow 版本在你的基础设施中能正常工作,安装最新的候选版本可能会对你有所帮助。
不建议将候选版本用于实际生产环境,它们仅用于测试验证。
要安装特定版本的 MLflow 最新候选版本,请参考以下使用 MLflow 2.14.0 作为示例的代码
# install the latest release candidate
pip install --pre mlflow

# or install a specific rc version
pip install mlflow==2.14.0rc0
步骤 2 - 启动 Tracking Server
使用托管 MLflow Tracking Server
有关使用托管 MLflow Tracking Server 的详细选项,包括如何创建带有托管 MLflow 的 Databricks 免费试用账户,请参阅tracking server 选项指南。
(可选) 运行本地 Tracking Server
我们将启动一个本地 MLflow Tracking Server,本快速入门将连接到它来记录数据。在终端中运行
mlflow server --host 127.0.0.1 --port 8080
你可以选择任何你想要的端口,只要它未被占用即可。
设置 Tracking Server URI (如果未使用 Databricks 托管 MLflow Tracking Server)
如果你使用的是非 Databricks 提供的托管 MLflow Tracking Server,或者正在运行本地 tracking server,请确保使用以下命令设置 tracking server 的 uri
import mlflow

mlflow.set_tracking_uri(uri="http://<host>:<port>")
如果在你的 notebook 或运行时环境中未设置此项,运行记录将保存在本地文件系统中。
步骤 3 - 训练模型并准备用于记录的元数据
在本节中,我们将使用 MLflow 记录模型。步骤概览如下
- 加载和准备 Iris 数据集用于建模。
- 训练一个 Logistic Regression 模型并评估其性能。
- 准备模型超参数并计算用于记录的指标。
import mlflow
from mlflow.models import infer_signature

import pandas as pd
from sklearn import datasets
from sklearn.model_selection import train_test_split
from sklearn.linear_model import LogisticRegression
from sklearn.metrics import accuracy_score, precision_score, recall_score, f1_score


# Load the Iris dataset
X, y = datasets.load_iris(return_X_y=True)

# Split the data into training and test sets
X_train, X_test, y_train, y_test = train_test_split(
    X, y, test_size=0.2, random_state=42
)

# Define the model hyperparameters
params = {
    "solver": "lbfgs",
    "max_iter": 1000,
    "multi_class": "auto",
    "random_state": 8888,
}

# Train the model
lr = LogisticRegression(**params)
lr.fit(X_train, y_train)

# Predict on the test set
y_pred = lr.predict(X_test)

# Calculate metrics
accuracy = accuracy_score(y_test, y_pred)
步骤 4 - 将模型及其元数据记录到 MLflow
下一步,我们将使用训练好的模型、模型拟合指定的超参数以及通过评估模型在测试数据上的性能计算出的损失指标来记录到 MLflow。
我们将采取的步骤是
- 启动一个 MLflow 运行 (run) 上下文,开始一个新的运行,我们将模型和元数据记录到其中。
- 记录模型参数和性能指标。
- 为运行添加标签,以便轻松检索。
- 在记录(保存)模型的同时,在 MLflow Model Registry 中注册模型。
虽然将整个代码包裹在 start_run 块中是有效的,但这不推荐。如果模型的训练或任何其他与 MLflow 相关操作无关的代码部分出现问题,将会创建一个空或部分记录的运行,这将需要手动清理无效的运行。最好将训练执行放在运行上下文块之外,以确保可记录的内容(参数、指标、工件和模型)在记录之前完全准备好。
# Set our tracking server uri for logging
mlflow.set_tracking_uri(uri="http://127.0.0.1:8080")

# Create a new MLflow Experiment
mlflow.set_experiment("MLflow Quickstart")

# Start an MLflow run
with mlflow.start_run():
    # Log the hyperparameters
    mlflow.log_params(params)

    # Log the loss metric
    mlflow.log_metric("accuracy", accuracy)

    # Set a tag that we can use to remind ourselves what this run was for
    mlflow.set_tag("Training Info", "Basic LR model for iris data")

    # Infer the model signature
    signature = infer_signature(X_train, lr.predict(X_train))

    # Log the model
    model_info = mlflow.sklearn.log_model(
        sk_model=lr,
        artifact_path="iris_model",
        signature=signature,
        input_example=X_train,
        registered_model_name="tracking-quickstart",
    )
步骤 5 - 将模型加载为 Python 函数 (pyfunc) 并用于推理
记录模型后,我们可以通过以下方式进行推理
- 使用 MLflow 的
pyfunc风格加载模型。 - 使用加载的模型对新数据运行预测。
我们使用的 Iris 训练数据是 numpy 数组结构。但是,我们也可以将 Pandas DataFrame 提交给 predict 方法,如下所示。
# Load the model back for predictions as a generic Python Function model
loaded_model = mlflow.pyfunc.load_model(model_info.model_uri)

predictions = loaded_model.predict(X_test)

iris_feature_names = datasets.load_iris().feature_names

result = pd.DataFrame(X_test, columns=iris_feature_names)
result["actual_class"] = y_test
result["predicted_class"] = predictions

result[:4]
此代码的输出将如下所示
| sepal length (cm) | sepal width (cm) | petal length (cm) | petal width (cm) | actual_class | predicted_class |
|---|---|---|---|---|---|
| 6.1 | 2.8 | 4.7 | 1.2 | 1 | 1 |
| 5.7 | 3.8 | 1.7 | 0.3 | 0 | 0 |
| 7.7 | 2.6 | 6.9 | 2.3 | 2 | 2 |
| 6.0 | 2.9 | 4.5 | 1.5 | 1 | 1 |
步骤 6 - 在 MLflow UI 中查看运行
为了查看运行结果,我们可以导航到 MLflow UI。由于我们已经在 https://:8080 启动了 Tracking Server,我们可以直接在浏览器中访问该 URL。
打开网站后,你将看到类似于以下的界面
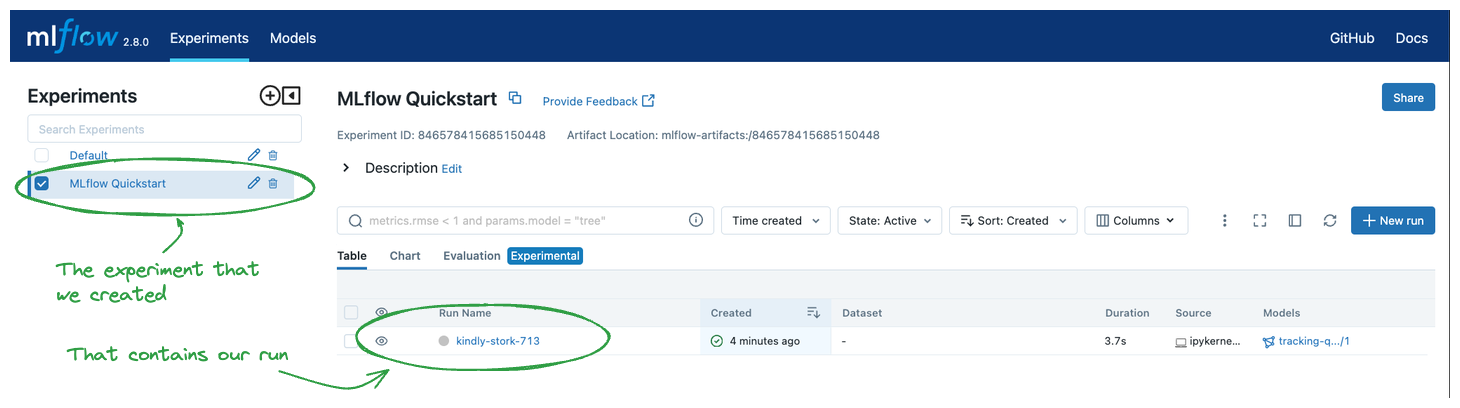
点击我们创建的实验名称(“MLflow Quickstart”)将显示与该实验相关的运行列表。你应该会看到为该运行随机生成的一个名称,右侧的 Table 列表视图中不会显示其他内容。
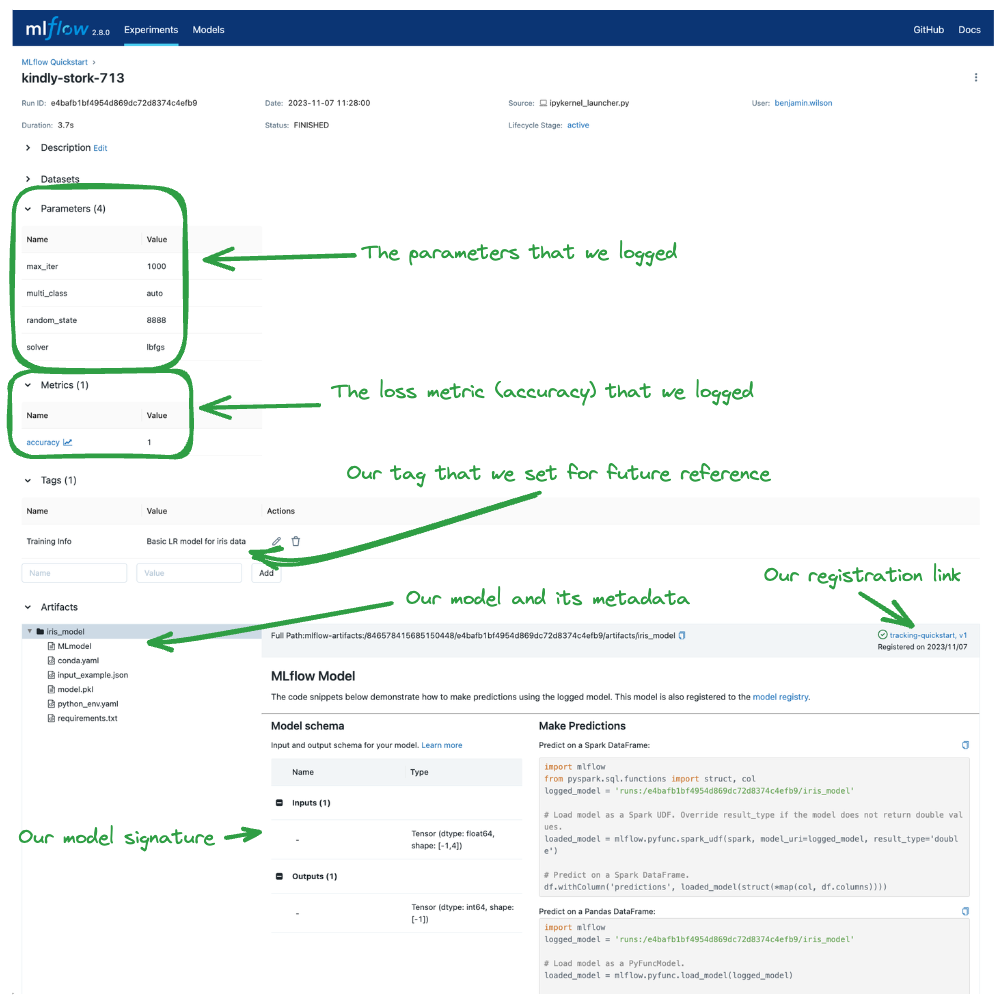
点击运行名称将带你进入运行详情页面,其中显示了我们记录的详细信息。下方已突出显示了 UI 中记录这些数据的方式和位置。
总结
恭喜你完成了 MLflow Tracking 快速入门!你现在应该对如何使用 MLflow Tracking API 记录模型有了基本的了解。
如果你对更深入的教程感兴趣,请参阅MLflow 入门教程,这是进一步了解 MLflow 的不错选择!