MLflow Tracking 快速入门
本快速入门的目的是提供 MLflow 跟踪最核心 API 的快速指南。只需几分钟跟随本快速入门,您将学会:
- 如何使用 MLflow 日志记录 API 记录参数、指标和模型
- 如何在 MLflow UI 中导航到模型
- 如何加载已记录的模型以进行推理
步骤 1 - 设置 MLflow
MLflow 在 PyPI 上可用。如果您尚未在系统上安装它,可以使用以下命令进行安装:
pip install mlflow
然后,请按照 设置 MLflow 指南中的说明进行 MLflow 的设置。
如果您只想快速开始,请在笔记本单元格中运行以下代码:
import mlflow

mlflow.set_experiment("MLflow Quickstart")
步骤 2 - 准备训练数据
在训练我们的第一个模型之前,让我们准备训练数据和模型超参数。
import pandas as pd
from sklearn import datasets
from sklearn.model_selection import train_test_split
from sklearn.linear_model import LogisticRegression
from sklearn.metrics import accuracy_score, precision_score, recall_score, f1_score

# Load the Iris dataset
X, y = datasets.load_iris(return_X_y=True)

# Split the data into training and test sets
X_train, X_test, y_train, y_test = train_test_split(
    X, y, test_size=0.2, random_state=42
)

# Define the model hyperparameters
params = {
    "solver": "lbfgs",
    "max_iter": 1000,
    "multi_class": "auto",
    "random_state": 8888,
}
步骤 3 - 使用 MLflow Autologging 训练模型
在此步骤中,我们将在上一步加载的训练数据上训练模型,并将模型及其元数据记录到 MLflow。最简单的方法是使用 MLflow 的 Autologging 功能。
import mlflow

# Enable autologging for scikit-learn
mlflow.sklearn.autolog()

# Just train the model normally
lr = LogisticRegression(**params)
lr.fit(X_train, y_train)
只需添加一行代码 mlflow.sklearn.autolog(),您就可以两全其美:您可以专注于训练模型,而 MLflow 将负责其余部分。
- 保存训练好的模型。
- 在训练期间记录模型的性能指标,例如准确率、精确率、AUC 曲线。
- 记录用于训练模型的超参数值。
- 跟踪元数据,如输入数据格式、用户、时间戳等。
要了解有关 autologging 和支持库的更多信息,请参阅Autologging 文档。
步骤 4 - 在 MLflow UI 中查看运行
要查看训练结果,您可以访问跟踪服务器 URL 来访问 MLflow UI。如果您尚未启动跟踪服务器,请打开一个新的终端,在 MLflow 项目的根目录下运行以下命令,然后通过 https://:5000(或您指定的端口号)访问 UI。
mlflow server --port 5000
打开网站后,您将看到一个类似于以下内容的屏幕:
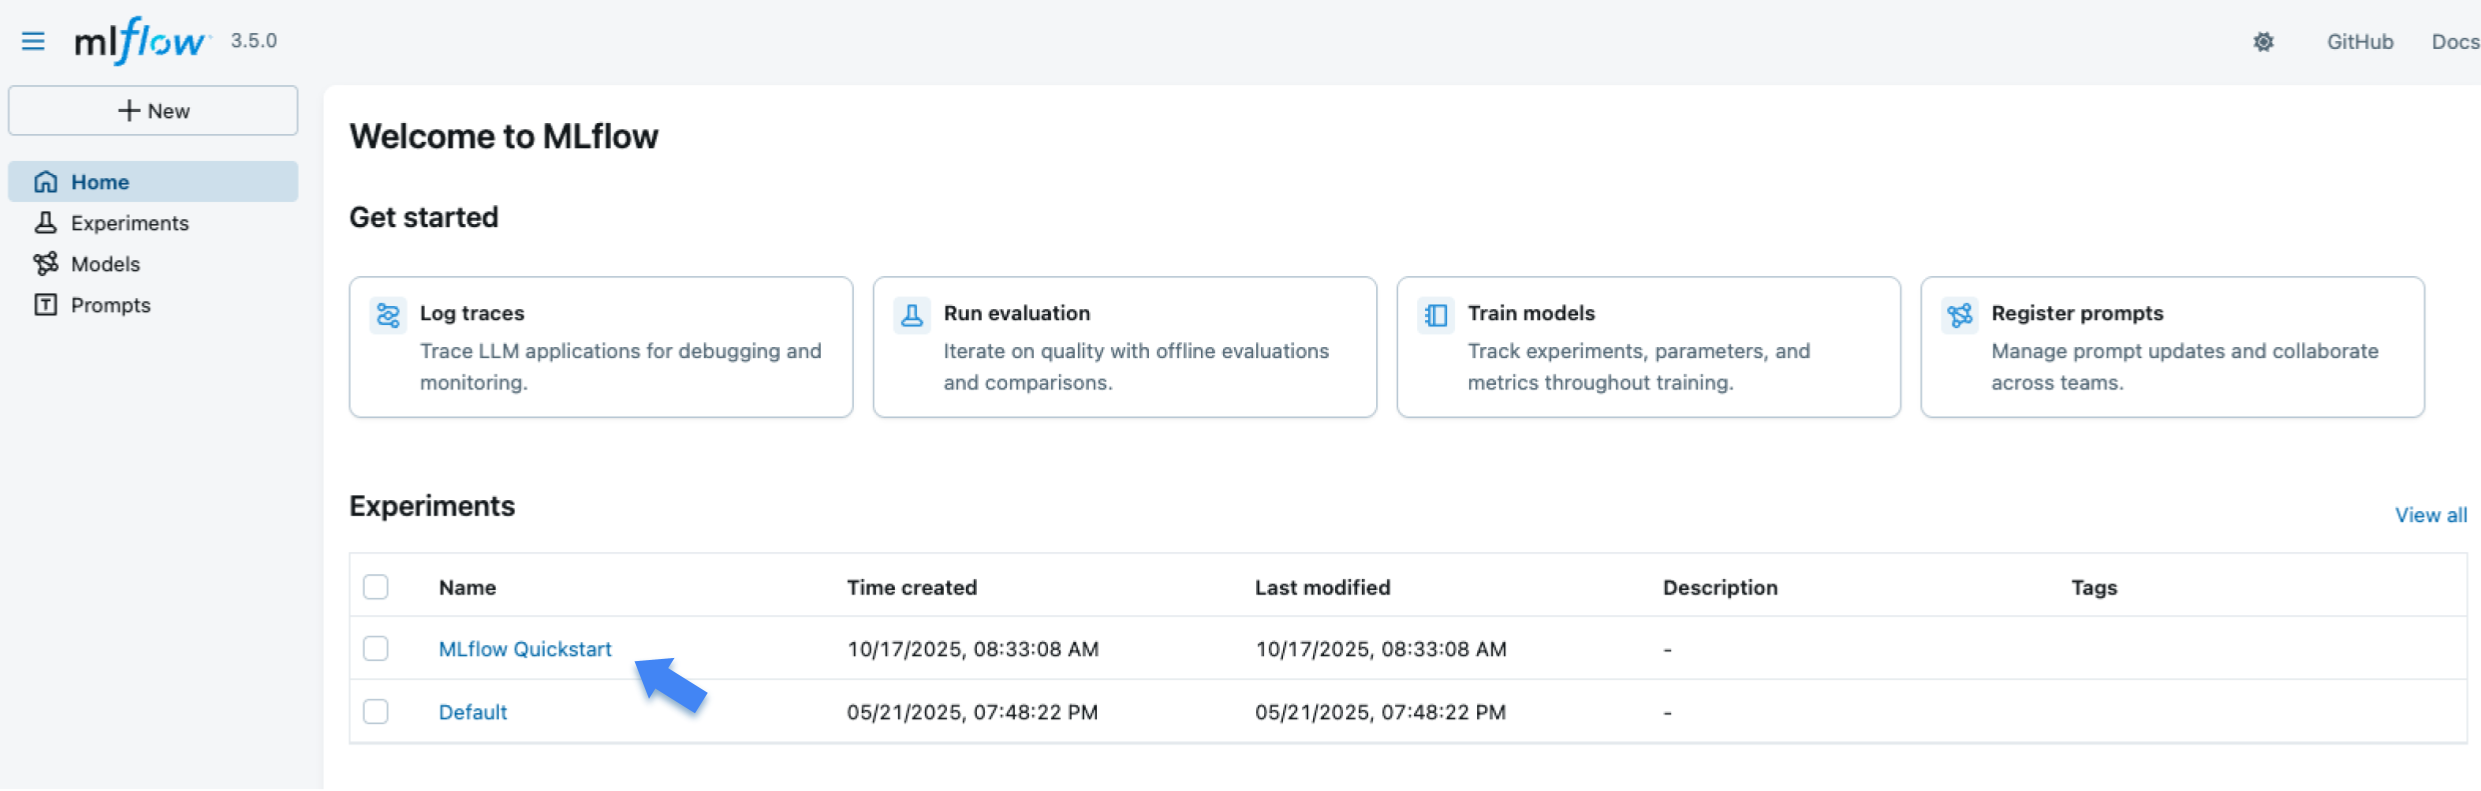
“Experiments”部分显示了(最近创建的)实验列表。点击“MLflow Quickstart”实验。
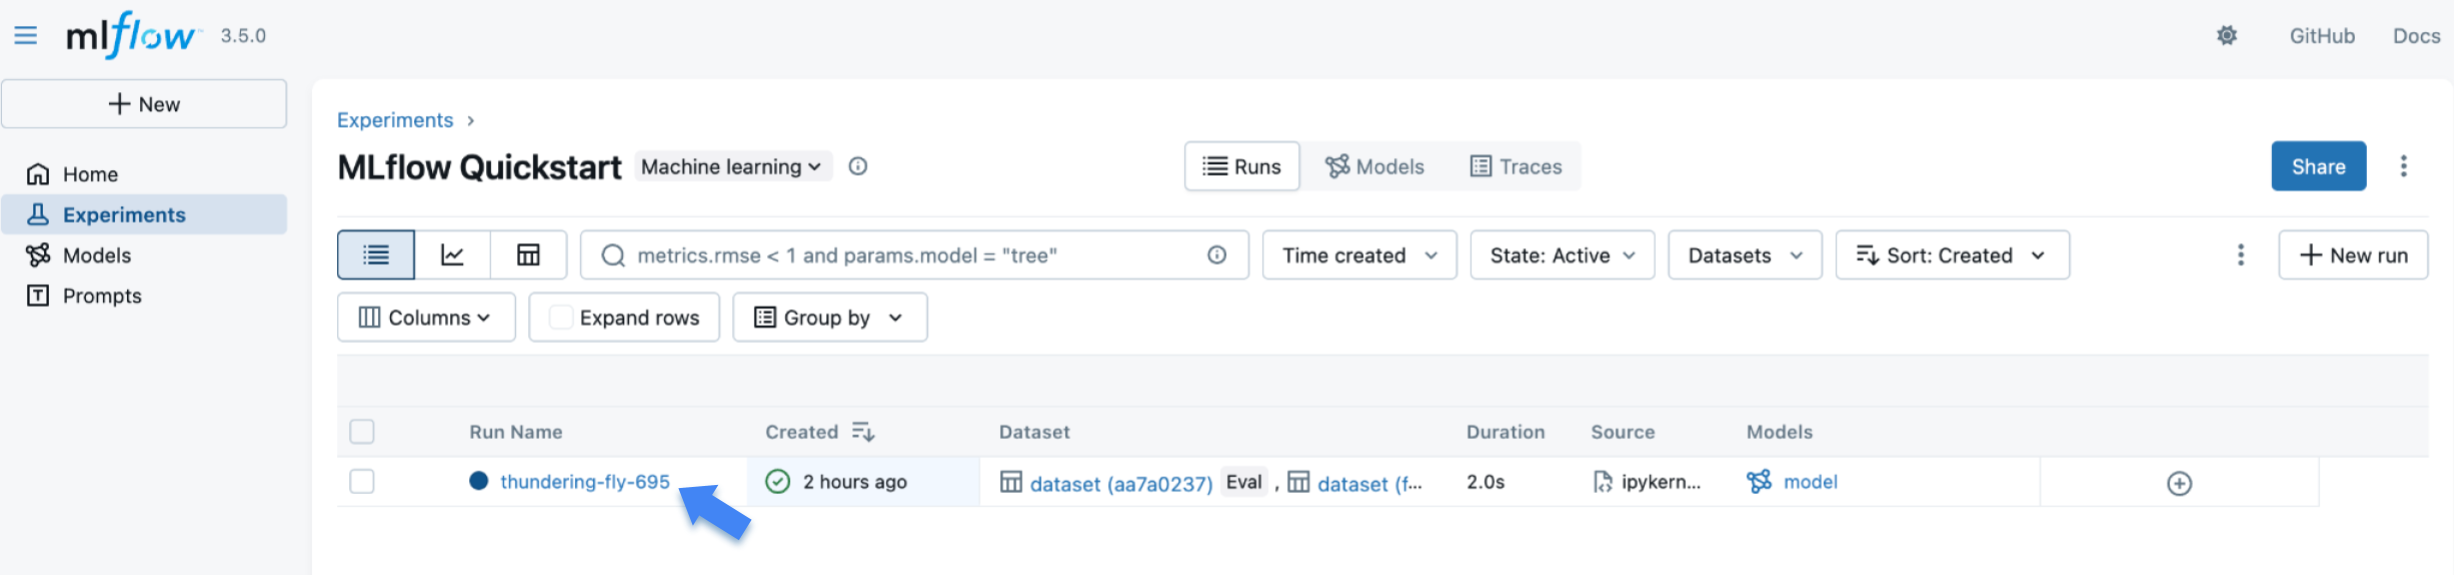
MLflow 创建的训练运行列在表中。点击运行以查看详细信息。
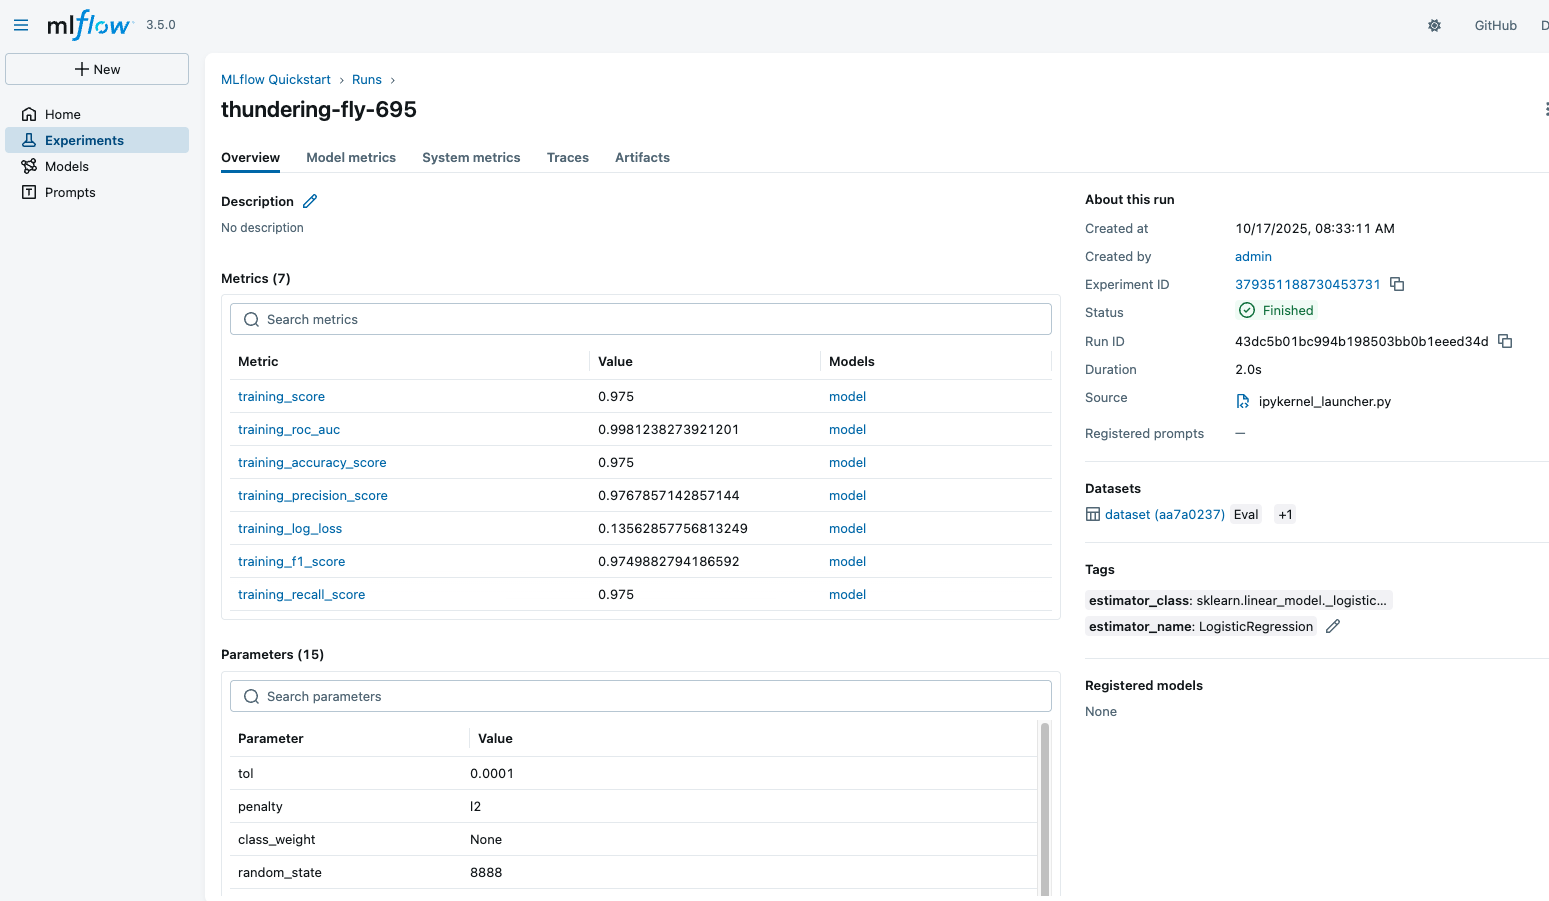
运行详细信息页面显示了运行的概述、记录的指标、超参数、标签等。请随意探索 UI,查看不同的视图和功能。
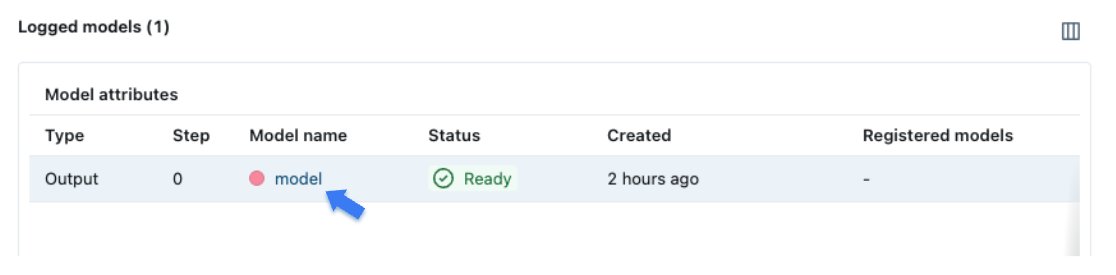
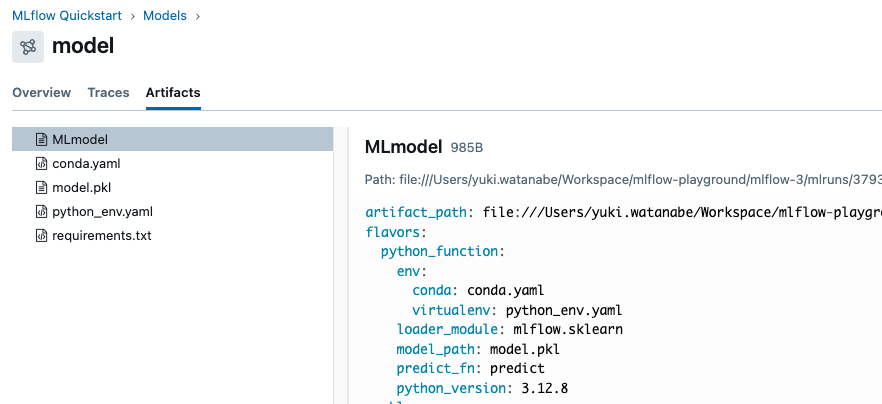
向下滚动到“Model”部分,您将看到在训练期间记录的模型。点击模型以查看详细信息。
模型页面显示类似的元数据,如性能指标和超参数。它还包括一个“Artifacts”部分,其中列出了在训练期间记录的文件。您还可以看到环境信息,例如 Python 版本和依赖项,这些都已保存以确保可重现性。
步骤 5 - 手动记录模型和元数据
现在我们已经了解了如何使用 MLflow autologging 记录模型训练运行,让我们更进一步,学习如何手动记录模型和元数据。当您希望更精细地控制日志记录过程时,这很有用。
我们将采取的步骤是:
- 初始化 MLflow **运行**上下文,以启动一个我们将记录模型和元数据的新运行。
- 训练和测试模型。
- 记录模型参数和性能指标。
- 为运行打标签以便于检索。
# Start an MLflow run
with mlflow.start_run():
    # Log the hyperparameters
    mlflow.log_params(params)

    # Train the model
    lr = LogisticRegression(**params)
    lr.fit(X_train, y_train)

    # Log the model
    model_info = mlflow.sklearn.log_model(sk_model=lr, name="iris_model")

    # Predict on the test set, compute and log the loss metric
    y_pred = lr.predict(X_test)
    accuracy = accuracy_score(y_test, y_pred)
    mlflow.log_metric("accuracy", accuracy)

    # Optional: Set a tag that we can use to remind ourselves what this run was for
    mlflow.set_tag("Training Info", "Basic LR model for iris data")
步骤 6 - 加载模型以进行推理。
记录模型后,我们可以通过以下方式进行推理:
- 使用 MLflow 的
pyfunc格式加载模型。 - 使用加载的模型在新数据上运行预测。
要将模型加载为本地 scikit-learn 模型,请使用 mlflow.sklearn.load_model(model_info.model_uri) 而不是 pyfunc 格式。
# Load the model back for predictions as a generic Python Function model
loaded_model = mlflow.pyfunc.load_model(model_info.model_uri)

predictions = loaded_model.predict(X_test)

iris_feature_names = datasets.load_iris().feature_names

result = pd.DataFrame(X_test, columns=iris_feature_names)
result["actual_class"] = y_test
result["predicted_class"] = predictions

result[:4]
此代码的输出将类似如下:
| 萼片长度 (cm) | 萼片宽度 (cm) | 花瓣长度 (cm) | 花瓣宽度 (cm) | actual_class | predicted_class |
|---|---|---|---|---|---|
| 6.1 | 2.8 | 4.7 | 1.2 | 1 | 1 |
| 5.7 | 3.8 | 1.7 | 0.3 | 0 | 0 |
| 7.7 | 2.6 | 6.9 | 2.3 | 2 | 2 |
| 6.0 | 2.9 | 4.5 | 1.5 | 1 | 1 |
后续步骤
恭喜您完成了 MLflow 跟踪快速入门!您现在应该对如何使用 MLflow 跟踪 API 记录模型有了基本的了解。
- MLflow for GenAI:了解如何将 MLflow 用于 GenAI/LLM 开发。
- MLflow for Deep Learning:了解如何将 MLflow 用于 PyTorch、TensorFlow 等深度学习框架。
- MLflow Tracking:详细了解 MLflow 跟踪 API。
- Self-hosting Guide:了解如何自托管 MLflow 跟踪服务器并为其设置团队协作。